
Wedge or Descending Triangle? TECHNICAL
posted on
Feb 15, 2008 04:40PM

(PRESS PROFILE TAB FOR FACT SHEET & UPDATES)

It's hard to determine if the TDC pattern is a falling wedge (bullish) or a descending triangle (bearish). Definitions at bottom. Look at our chart as of today. I put my money on the falling wedge pattern. Anybody else?
Wedge
The wedge chart pattern can be either a continuation or reversal pattern. It is similar to a symmetrical triangle except that the wedge pattern slants in an upward or downward direction, while the symmetrical triangle generally shows a sideways movement. The other difference is that wedges tend to form over longer periods, usually between three and six months.
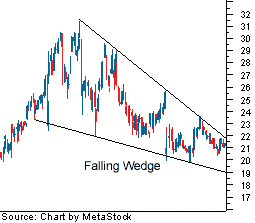
Figure 6
The fact that wedges are classified as both continuation and reversal patterns can make reading signals confusing. However, at the most basic level, a falling wedge is bullish and a rising wedge is bearish. In Figure 6, we have a falling wedge in which two trendlines are converging in a downward direction. If the price was to rise above the upper trendline, it would form a continuation pattern, while a move below the lower trendline would signal a reversal pattern.
OR is it a:
Triangles
Triangles are some of the most well-known chart patterns used in technical analysis. The three types of triangles, which vary in construct and implication, are the symmetrical triangle, ascending and descending triangle. These chart patterns are considered to last anywhere from a couple of weeks to several months.
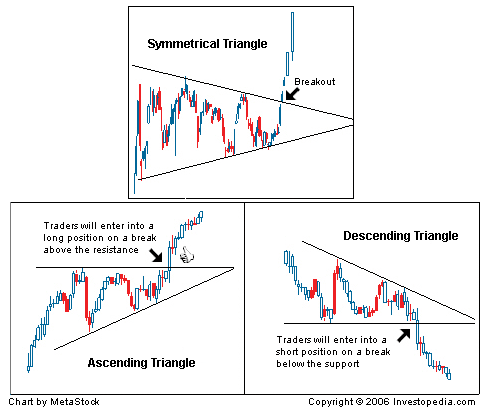
Figure 4
The symmetrical triangle in Figure 4 is a pattern in which two trendlines converge toward each other. This pattern is neutral in that a breakout to the upside or downside is a confirmation of a trend in that direction. In an ascending triangle, the upper trendline is flat, while the bottom trendline is upward sloping. This is generally thought of as a bullish pattern in which chartists look for an upside breakout. In a descending triangle, the lower trendline is flat and the upper trendline is descending. This is generally seen as a bearish pattern where chartists look for a downside breakout
In iether case, a break out (up or down) is coming soon.
skeleg