
Charts & Comments
posted on
Oct 24, 2014 12:25PM

Saskatchewan's SECRET Gold Mining Development.

$IRX Weekly
The most important chart this week will have to be the discount rate, or the three-month treasury bill rate. Stockcharts presents a yield that is 10X the actual yield, so instead of 0.03%, it would be 0.003%.
On such occasions, yields on treasuries in the U.S. went negative, but any notion of negative nominal rates have been removed from just about every available source. There is probably no stronger incentive to hold fungible assets during a period of negative rates.
No notable reaction in U.S. bullion markets to negative rates in Europe and Japan:
via Nowandfutures.com - Negative Real Interest Rates
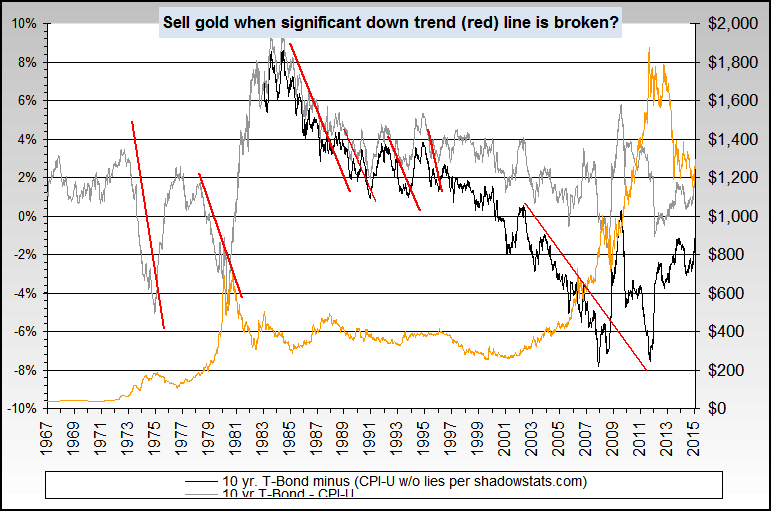
Interest rates on inflation adjusted charts are negative, but there's been no reaction in the gold price. Gold price should be advancing steadily on interest rate decline in the 10-year bond, but that has not occurred.
So either gold prices advance very strongly and unexpectedly, or the paradigm of negative real interest rates has outlived its usefulness.
Given where interest rates are now, gold prices should be trading around $1500/oz. The trend for interest rates vs. inflation is downwards.
source: http://www.nowandfutures.com/forecast.html#predict_gold
via INO.com - December 2014/Jun 2019 Spread
The spread between near futures and long futures have narrowed considerably, very likely this trend is meant to continue. Gold prices have not moved into backwardation as copper futures or oil prices have been. Copper is notable to the discussion, because of its truncated bull market during a time when stocks are in a bubble.
http://quotes.ino.com/charting/index.html?s=NYMEX_GC.Z14_M19.E&t=l&a=0&w=1&v=dmax
$Gold Weekly
While I think that a truncated bull market is in the cards for gold prices, the price chart has not necessarily violated any of the cardinal rules of elliot wave theory. The wave count is correct, but the paradigm is 'blown.'
There is little downside momentum, so this might mean sideways prices for a time, but we always have options expiry week to help guage the price trend:
$Gold:$Silver
The one chart with my attention is the gold/silver ratio, where GBN.V share prices are becoming strongly inversely correlated with advances in the ratio. This would either indicate a buying point or selling point.
It would make a interesting speculation to take the shares on offer within a TFSA. You have to remember that a reverse split is in the cards when accumulating shares.
Theoretically the shares can go no lower, though you might have to sit on risk for some time. Depending on how aggressively the reverse split is carried out, and to what extent is an open question. All of the available research you need is in the link library and profile. Very detailed aerial photos of mining prospects are available through Bing Maps.
It comes as a surprise that this indicator would have held true for so long.
Proxy Vote
My guess is that there's nothing new to the way the proxy vote is being handled. You submit the vote, but then a show of hands during the shareholder meeting is always thwarted by the managing director's vote.
Proxy forms were not included with the management circular, though you can get the available form via SEDAR and fax it in.
You can still fax your proxy vote in by the close of business today.
http://www.sedar.com/DisplayCompanyDocuments.do?lang=EN&issuerNo=00007862
-F6