
here's some ta for bnk
posted on
Jul 19, 2011 12:11PM

Edit this title from the Fast Facts Section

Part 2: The Technical Outlook -- and Conclusion -- for Bankers Petroleum Stock
While the fundamental aspects of the company provide some measure of safety and understanding of future price potential, the technical aspects of the actual stock price provide additional insight for potential price targets and also when to enter.
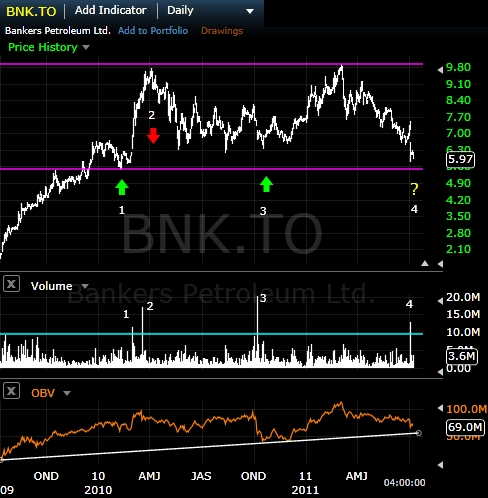
Figure 1 is a daily chart of BNK-TSX and shows that since 2010 the stock has been within a large price range between $5.48 and $9.92. This price range is marked by horizontal pink lines.
Figure1. BNK-TSX Daily Chart with Volume and On Balance Volume (OBV)
 |
| Source: Freestockcharts.com |
This price range indicates the stock has struggled to move down to $6 since early 2010; at a current price of $5.97 (July 11, 2011 Close price) this potentially provides a buying opportunity. Note the Volume indicator at the bottom of the chart. There are four volume bars labelled 1,2,3 and 4. These represent the times over the last 2 years volume has exceeded 10 million shares/day. Each time this has occurred a major price reversal has taken place (within the range).
Based on this, we are currently at point 4, marked by a “?” as the future direction is not certain. Yet the evidence points to an upside move. Massive selling volume entered the market at point 4 (July 6, 2011) and even on that volume the price could not make it the bottom of the range. This is a sign of a potential turning point. Historically a price reversal has occurred within three weeks or less following a volume spike, but price could drift lower within that timeframe.
The price target is near the range high: $9.00 conservatively over the next two to eight months. This target is slightly below the most recent price high seen in April, 2011. A slightly more aggressive target would be right near the range high at $9.50. The potential exists for higher price movement, especially if the stock moves above $10. Using multiple exits may be useful, for example selling part of a position at $9.00 and holding the rest if the stock moves higher.
A move above $10 provides a technical price target of $14.00. This is attained by taking the difference between the high close price and the low close price of the range, $9.85-$5.51=$4.34, and then adding that to the breakout price (old high) of $9.85, providing us a precise price target of $14.19 (It is common to round down when using this method).
If the price drops below $5.50 it is an indication the stock may go lower. Just as a potential move above the current range (above $10) is likely to spur buying, a move below the range is likely to bring in sellers as all gains since 2010 would be erased and anyone who bought the stock over the last 18 months would be in a negative position. Therefore stops can be placed in the $5.50-$5.00 range to limit potential risk in case of unforeseen bad news.
An additional note in regards to the chart is what is called “divergence.” Divergence is when an indicator is moving in a different direction than price. The On Balance Volume (OBV) in Figure 1 is an indicator which measures buying volume versus selling volume. The OBV indicator shows that buying volume has been trending higher while price has been range bound. Even though OBV is moving slightly lower now, the fact OBV is moving higher overall is an indicator of buying interest and that a reversal will occur at some point in price as long as the OBV overall trend continues upward.
------------------------