What’s Doctor Copper Predicting for the Markets?
posted on
Dec 07, 2010 08:01AM

Edit this title from the Fast Facts Section

http://seekingalpha.com/article/240389-whats-doctor-copper-predicting-for-the-markets?source=dashboard_macro-view
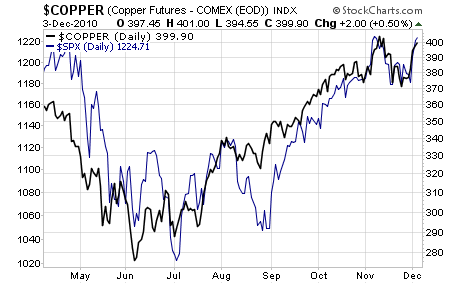
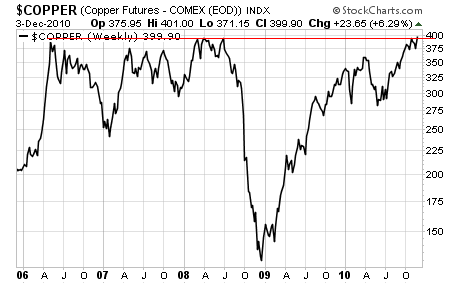
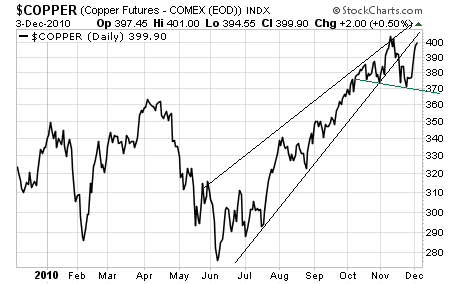
Copper is often called Dr. Copper as the metal is considered a bellwether for the world economy due to its close correlation to economic growth (used by many industries, copper typically rallies when the world economy is growing). Indeed, one of the first signs that the market was going to rally, rather than fall off a cliff during the Euro Crisis Round 1 in June, came from Copper. As the chart below shows, the metal bottomed in June, preceding the stock bottom by almost a month. Since that time, the correlation between stocks and copper has strengthened to the point that today, the two assets are trading together on a near tick-for-tick basis: With that in mind, today I want to focus on the metal for signs of what’s to come in the markets. The first and most important item to note is that copper is coming up against long-term resistance. A breakout here would indicate the “inflation trade” is prepared to explode higher in a major way. Is this a sure thing? Not necessarily, copper has actually just formed a rising bearish wedge pattern in the last six months. These patterns tend to be topping patterns which preclude sharp sell-offs down to the base (in copper’s case 2.80 per pound) when broken. As you can see, copper broke this pattern in early November. This latest rally has brought copper up to test the broken trend-line. A rejection here would likely precede a sharp sell-off back down to $3.70 per pound. And if we take out the downward support line (green line above) then we’re going down in a BIG way. Keep your eyes on the Doctor, he may be flashing a warning signal to stocks.