
BullMarketRun - Investor Alert: CDNX Getting Set To Blast Off
posted on
Aug 30, 2010 10:26AM

Edit this title from the Fast Facts Section

BMR turned very bullish on the CDNX inmid-July when we saw many technical indicators that suggested thismarket had bottomed out for the year at 1343. Since that early Julylow, the CDNX has climbed almost 11%. This is no“sucker rally” – it is the real thing as we have been emphasizing overthe last 6 weeks (contrary to the many dire predictions of anothermarket crash). A major breakout through the 1500 area on the CDNX is now imminent as BMR’s technical analyst explains below:
Thechart says it all. The Index has just started a new #1 Wave of aMotive Phase and should have many months of uptrend remaining. This is aVERY bullish scenario going into the usually strong September to Maytrading season. Buckle up - we are going to have a lot of strongtrading.
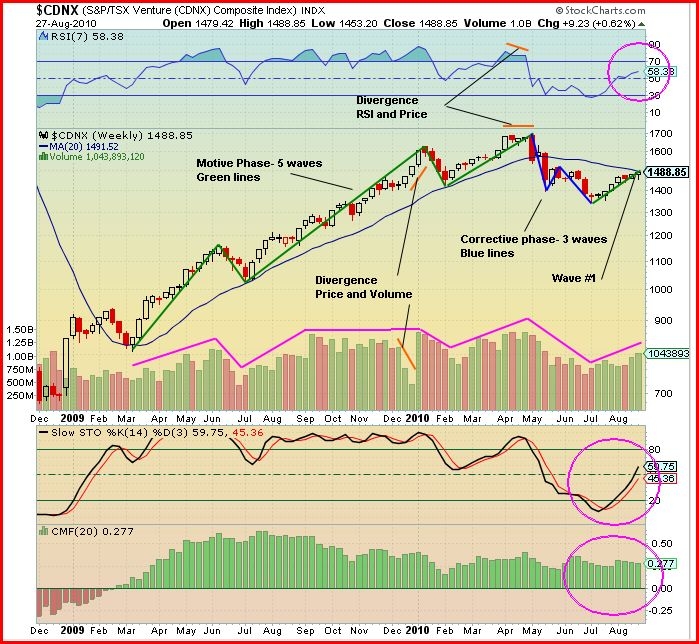
John: Last week the CDNX opened at1479, drifted lower to 1453 and then closed at its high of 1489 on goodvolume for a gain of over 9 points for the week.
On August 18 we showed that the expected breakout to the upside fromthis year’s low occurred during the 3rd week of July – 2 months earlierthan our comparative year of 2004. This is important for it indicatesstronger interest in the small and microcap stocks of the CDNX.
Today we will evaluate where the Index is in itsdevelopment at this crucial time by analyzing the 19 month weekly chart.Looking at the chart we see that starting in March, 2009, to the endof May, 2010 (14 months), there is a 5 Wave Motive Phase (green lines)in accordance with Elliott Wave Theory, then a 3 Wave Corrective Phase(blue lines) from the beginning of May this year to the end of June.Following that, a new Motive Phase (green line) Wave 1 started which iswhere we are at now.
The supporting moving average for the Motive Phase was the weeklySMA-20 (blue line) which broke to the downside this past May with theCorrective Phase. The new Wave 1 has climbed from the 2010 low and onFriday closed just below the weekly SMA-20. I expect the CDNX to cross above this SMA in the near future and resume its role of support. The CDNX is almost at the 1500 level where there is significant resistance. Once this is broken the next major resistance is at 1700.
Looking at the indicators:
We have said before that often the best indicator is volume. Ifyou compare the Mauve volume lines with the Motive Phase Waves you willsee they move in concert, thus volume can be a good indicator of when aWave is peaking. Also we see that at the end of the 3rd Wave there wasa bearish divergence of the CDNX and volume (orange lines). When the volume falls during the Corrective Phase this indicates the uptrend is still intact.
The RSI shows a bearish divergence at the end of Wave 5 (orangelines), indicating the 5th Wave was about to end and the CorrectivePhase was set to begin. During the Corrective Phase the RSI dropped tothe oversold region but has recovered during this new Wave 1 and isnow in bullish territory, above 50% and climbing. - very bullish.
The Slow Stochastics had the %K (black line) cross above the %D (redline) below 20% at the low point of the Index and has since climbedabove the 50% level and is still climbing – very bullish.
The Chaikin Money Flow (CMF) indicator is above the zero line at the .28 level which is considered very bullish. It’s interesting that the CMF remained bullish even during the Corrective Phase. This indicator has remained bullish for the last 18 months.
Outlook: The chart says it all. The Index has juststarted a new Wave 1 of a Motive Phase and should have many months ofuptrend remaining. This is a VERY bullish scenario going into the usually strong September to May trading season. Buckle up – we are going to have a lot of strong trading.