I mentioned yesterday when I closed out the gold position that we had since spring 09, that the chart looked more like something I'd short than go long. However, the movements in this commodity are so random at times, I don't really like to get involved on the short side. But in retrospect, it looks like "short" would have been a good move.
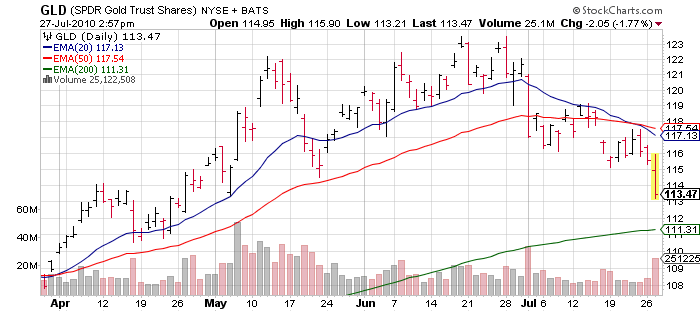
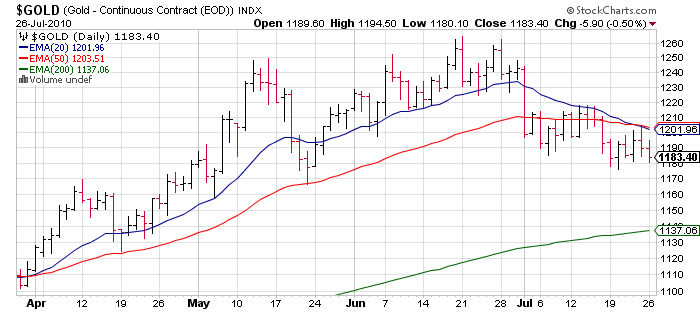
I am using the gold ETF (GLD) for charting purposes (since stockcharts.com has a 1-day delay on commodities) but the actual commodity is down to $1159 or so... the ETF tracks the commodity quite closely.
ETF - real time
Commodity - delayed by one day on chart
I would say it is a very high probability we're going to see a move down to the 200-day moving average ($111.31 on ETF, $1137 on commodity). At that point the very nimble who are short will cover (and go long for a quick trade), we'll get a cursory bounce off support and then the real action will happen. How big of a bounce, and does the bounce lead to a failure (a retest of the move down and then breaking to new lows)?
Disclosure: No position