How Far Can This Rally Go? Here's How to Play It
posted on
Jul 27, 2010 08:09AM

Edit this title from the Fast Facts Section

http://seekingalpha.com/article/216628-how-far-can-this-rally-go-here-s-how-to-play-it?source=dashboard_macro-view
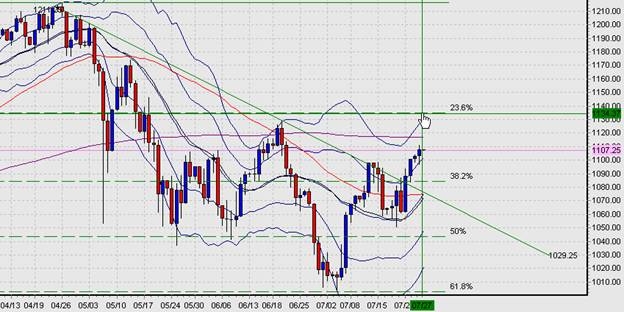
The Short Answer: Using the S&P 500 as a guide, probably up to around 1140, or about a 3% gain from its current level. Here’s why, and what to do about it. Technical Evidence: Bearish, Rally Near Its End The S&P 500 chart below (click to enlarge) tells us the following: With the S&P 500 futures currently at 1107, major resistance lies just ahead with its: Implications This triple phased resistance suggests the rally is likely to fade around or below 1140 at best, allowing for another 3% at most. That’s only enough room for those trading with very short term time frames, 1-3 days or intraday traders. This is no time for taking on new long term, long positions. Instead, longer term multi-week or longer traders should start planning short positions for when the trend fades. This current bounce seems quite similar to the rally that peaked June 21st. That one too broke the prevailing downtrend line but failed under the combined resistance of 200 and 50 day SMAs and the upper Bollinger band, and lost about 10% in the following 2 weeks. Remember, once the index hits its upper BB AND THEN pulls back away from that upper band for 2 consecutive days, it tends to test down to at least its 50 day SMA. Inter-Market Evidence: Bearish but Not Decisively So Fundamental Evidence Fundamentals support the view that the current bounce is just that, a short term bounce in continued longer term bear market for risk assets. Just a few highlights: What To Do Short term traders to continue following the trend higher as long as their technical indicators suggest. Stocks Everyone should be looking for entries for short plays and closing out long positions. Those needing to stay invested should consider buying longer term put options against major indices as insurance. Commodities Look to go short oil. Avoid gold as it should do well when the next trouble in the EU hits and raises fears about the Euro. Forex Despite their fundamental weaknesses, the JPY (FXY) and USD (UUP) remain the prime safe havens. The CHF (FXF) is # 3 safe haven but could suffer when further EU trouble hits given its close EU ties, and to a lesser extent so could the GBP (FXB). The commodity currencies make good shorts in times of fear, though the CAD (FXC) should be more resilient given its higher likelihood of interest rate increases and far healthier economy, complete with a reviving consumer spending sector. The Euro (FXE) is becoming a compelling short for when EU troubles resurface now that EUR shorts have unwound over the past week. Morgan Stanley has been recommending new EUR shorts. The EUR/USD is currently testing the 1.3000 level, which could be a good short entry if/when the pair rolls over back below this level. Remember, the EU bank stress tests proved so lenient that they are an open admission that EU banking is fragile and prone to trouble on any significantly bad news. Failed bond auctions are unlikely in the near term given ECB determination to prevent them, but as Hungary showed this past week by refusing to play ball with the IMF, there is enough weakness and political irresponsibility to spark something nasty. Those without access to forex accounts should consider opening them, or get currency exposure via the corresponding ETFs shown in parentheses.