
Stocks Are Undervalued; Problem Is Negative Technicals
posted on
May 28, 2010 07:51AM

Edit this title from the Fast Facts Section

http://seekingalpha.com/article/207439-stocks-are-undervalued-problem-is-negative-technicals
A positive 7-Year auction, but yields rise Thursday afternoon. Gold is trying to stay above $1200 with the euro between its 120-month simple moving average at 1.206 and my quarterly pivot at 1.2450, and crude oil alleviating an oversold condition. The major equity averages straddle the 200-day simple moving averages, which are resistances at 10,278 Dow and 1104 S&P 500.
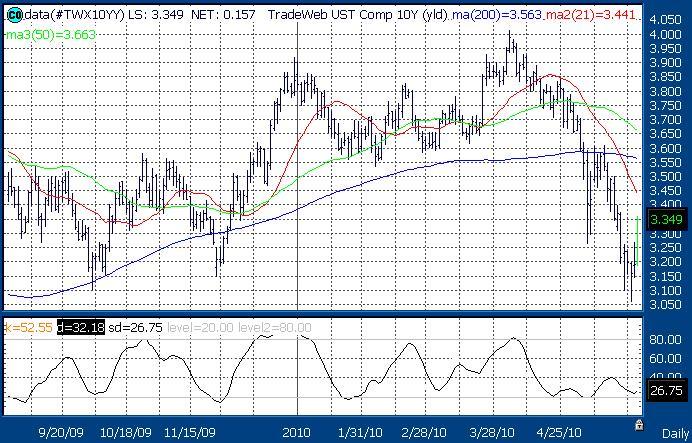
US Treasury Yields – Thursday’s $31 billion 7-Year auction gets a “C” grade as the yield came in at 2.815, which is cheaper than my annual pivot at 2.684. The bid to cover was strong at 2.88 and the indirect bid was 51%, above my 30% to 40% neutral zone. After testing 3.061 on Tuesday the yield on the 10-Year rose above my weekly pivot at 3.320. My quarterly support is 3.467 with my weekly pivot at 3.320 and daily resistance at 3.083. Courtesy of Thomson / Reuters
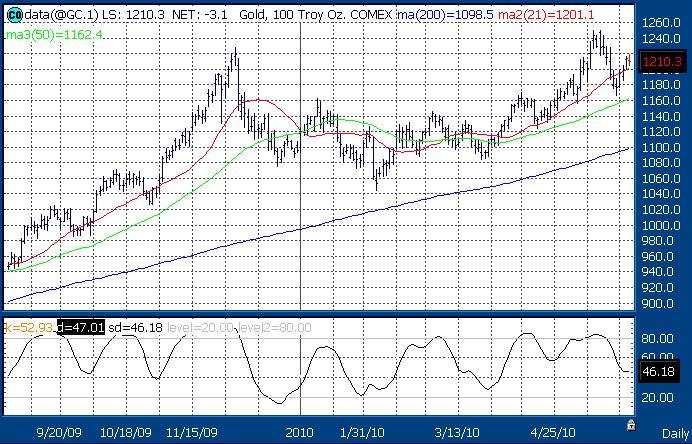
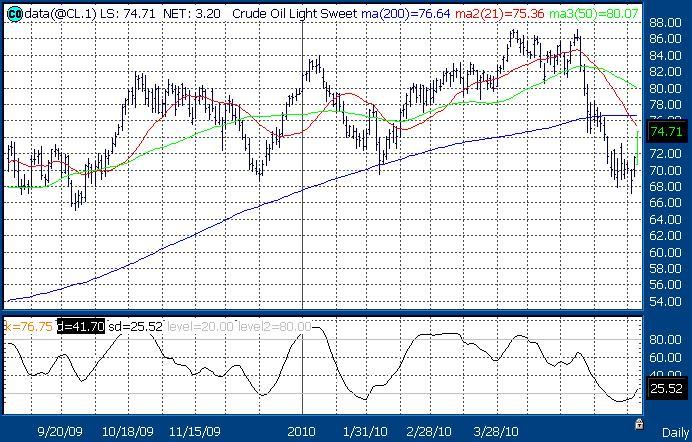
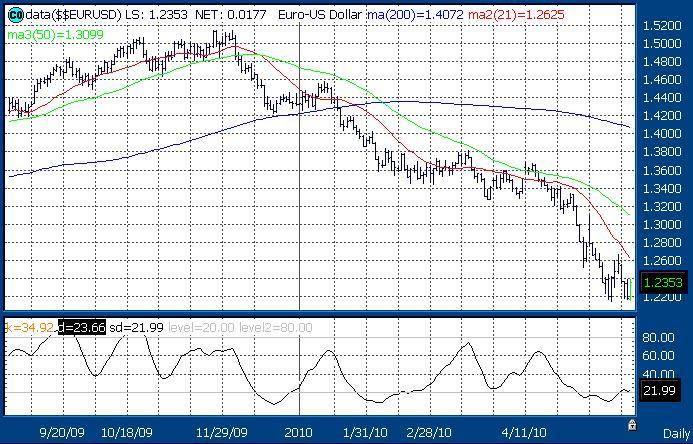
Comex Gold – has become currency of last resort primarily on euro weakness. The 50-day simple moving average is $1162.4 with the May 14th peak at $1249.7 on May 14th. Courtesy of Thomson / Reuters Nymex Crude Oil – is no longer oversold and in a trading range now between my quarterly value level at $68.03 and the 200-day simple moving average and my annual risky level at $76.64 and $77.05. Courtesy of Thomson / Reuters The Euro – has formed a trading range around my quarterly pivot at 1.2450 with this week’s resistance at 1.2690. The euro is no longer oversold, but it’s not on the rise either. A monthly close below the 120-month simple moving average at 1.206 would be the first since April 2003 Courtesy of Thomson / Reuters
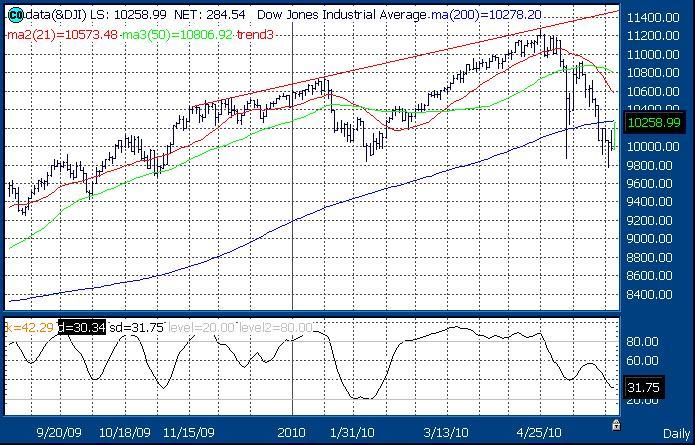
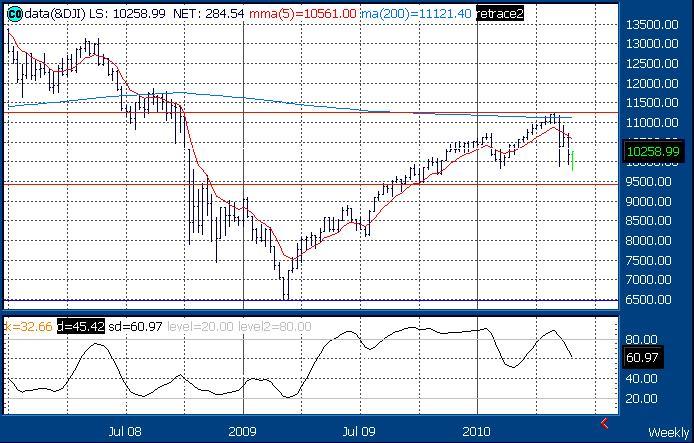
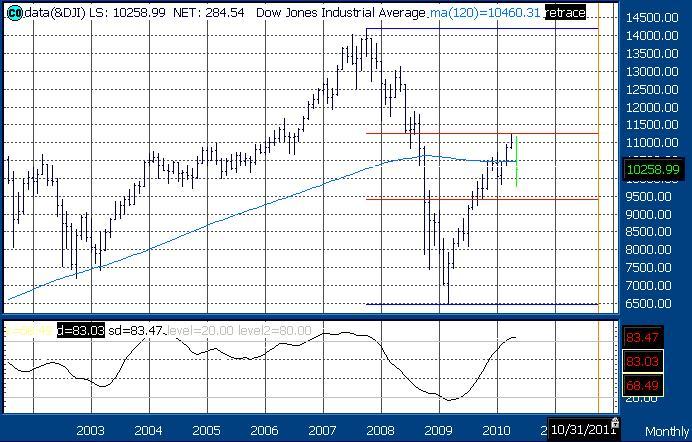
Dow Tracks – Daily, Weekly and Monthly Charts
Daily Dow:There’s an up trend resistance line that connects highs going back to November 2009 that was tested at the April 26th high. The daily chart profile is negative with the Dow below its 21-day simple moving average at 10,573. The Dow is below its 50-day and 200-day simple moving averages at 10,807 and 10,278. It seems that the April 26th high at 11,258 ends the bear market rally since March 2009, and starts the second leg of the multi-year bear market. Courtesy of Thomson / Reuters
Weekly Dow:The Dow ended last week below its 200-week simple moving average at 11,121, after testing the 61.8% Fibonacci Retracement of the October 2007 to March 2009 low at 11,246 with the April 26th high at 11,258.This is 1,000 points away from Thursday’s close. MOJO is now declining and weekly closes below the 5-week modified moving average at 10,561 keeps the weekly chart profile negative. I still predict Dow 8,500 before Dow 11,500. Courtesy of Thomson / Reuters
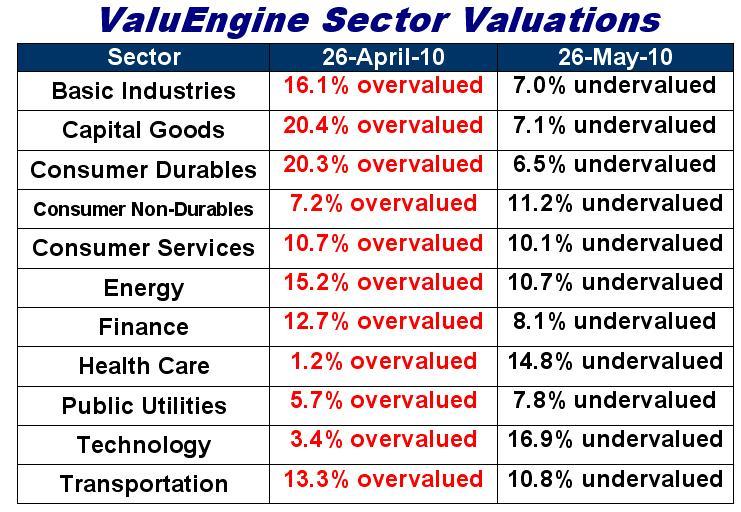
All of this talk today on Financial TV about a bull market correction,and that stocks are oversold is bunk. What are positive are equity valuations, which are cheaper now than on April 26th. The problem is the negative technicals on the daily and weekly charts and knowing that the monthly chart remains overbought. Right now sector valuations are cheap, but not nearly as cheap as in March 2009. I cringe when I hear “dollar cost averaging” as that strategy cost the average investor his equity wealth over the past ten years. Investors need to learn how to "Buy and Trade" using GTC Limit Orders to buy on weakness to a value level and to sell on strength to a risky level. I provide this guidance in the ValuTrader Model Portfolio and the Weekly ETF Report.
Monthly Dow: Back in March 2009 the Dow held the up trend that goes back to the low following “The Crash of 1987”. The Dow also held its 61.8% Fibonacci Retracement of the rally from the 1987 low and the October 2007 high. ValuEngine showed all eleven sectors as 32% to 45% undervalued. These were the reasons I predicted a 40% to 50% rally for stocks on March 6, 2009. The Dow is below its 120-month simple moving average at 10,460 with overbought monthly MOJO. Courtesy of Thomson / Reuters Over the past month sector valuations have shifted from eleven overvalued sectors to eleven undervalued sectors. The reasons for improved fundamentals include: improved 12-month trailing EPS, upgraded forward 12-month EPS estimates from Wall Street, lower stock prices and a lower 30-Year bond yield. My prediction is that the technicals will outweigh the fundamentals until the valuations return to where they were in March 2009. Disclosure: No positions
 About the author: Richard Suttmeier