
Bearish Pattern Active on Oil Chart
posted on
May 14, 2010 08:14AM

Edit this title from the Fast Facts Section

http://seekingalpha.com/article/204967-bearish-pattern-active-on-oil-chart
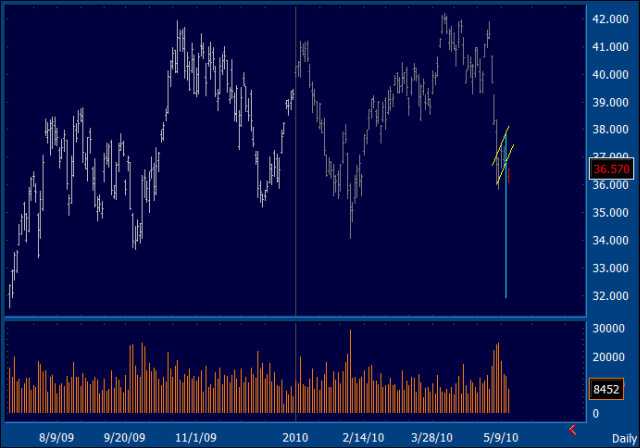
By Bryan McCormick The US Oil Fund (USO) has been on the verge of a breakout several times recently but, much as we see in the broader indexes, has never quite managed to come together technically. After three tries at year-to-date highs, the ETF dropped back toward the lows of its recent trading range. We can, however, still learn from examining this activity. First, the moving averages -- which I omitted from the chart below for visual clarity -- are fairly important. Price is below all of the moving averages, with a bearish crossing of the short- and intermediate-term averages. This alone is a warning of technical weakness. (Click to enlarge) In yellow I have shown the outline of a bearish "flag" pattern that became active today when price crossed below $36.70. The downside for the pattern, presuming that it stays active and completes, is to the $32 level shown by the light blue vertical line. Equally important to consider is what will likely happen to the broader tape if crude pricing breaks down. As we can see by the dips so far this year, drops in crude correlate well with declines in the S&P 500. Weak crude prices may be bullish for consumers but not necessarily for stocks. At least, that is what recent correlations are telling us. This time around, drops in commodities appear to be signaling concerns about the strength of the global rebound. Considering that the rally in our markets has been predicated on that recovery, we need to pay attention to what energy and materials are telling us. Disclosure: No positions
 About the author: optionMONSTER