Good stuff here from our friends at Data Diary who have pointed out a chart of valuations during a bear market. Many investors have been quick to note that many valuation metrics remain quite high (such as Shiller’s 10 year PE) and that the current bear market never hit historical trough levels seen at the bottom of other major bear market lows.
This chart (click to enlarge) shows the average valuation contraction of previous bear markets. According to this data we could have quite a ways lower to go before a true bottom is formed:
Another chart for the annals – this one from Sitka Pacific Capital Management (see the original article here).
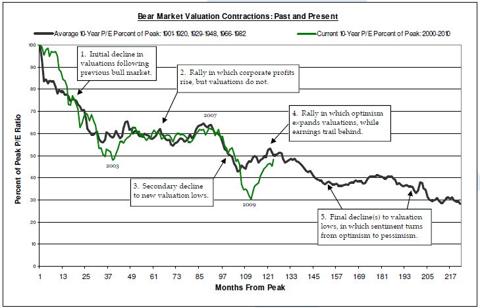
Source: Sitka Pacific via Data Diary


