As the markets have reversed lower, taking out last week's lows in many indexes, it is time to note the next big test areas.
The 50-day moving averages for the indexes were a test area I mentioned that could become the veritable line in the sand for the bulls and bears. Although we were some distance from there last week, we are not today. Breaks of those moving averages, especially on a closing basis, would be bearish.
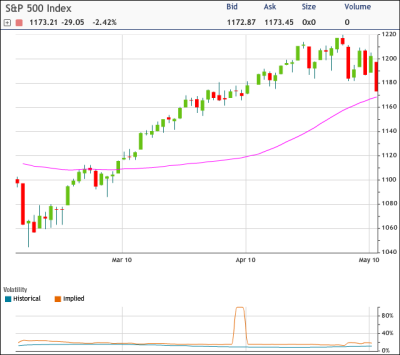
The S&P 500 is currently closest to its 50-day average (purple line on chart), at 1168.54 as of this writing. The Nasdaq 100 is also close by to current levels, with its 50-day last at 1952.87. The Russell 2000 is still quite a distance away, at 689.36.
For the bears, breaking the 50-days on a sustained basis is the key. For the bulls, the reverse is the case.
A successful test of a 50-day average that results in a rally would make this yet another instance where the bears have been handed every opportunity but have still lost control of the tape.


