
The Bears Are Wrong'? I Don't Think So
posted on
Mar 30, 2010 08:16AM

Edit this title from the Fast Facts Section

http://seekingalpha.com/article/196177-the-bears-are-wrong-i-don-t-think-so
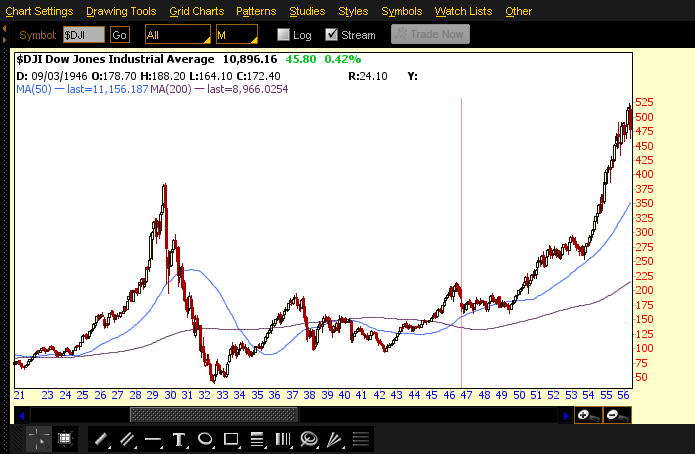
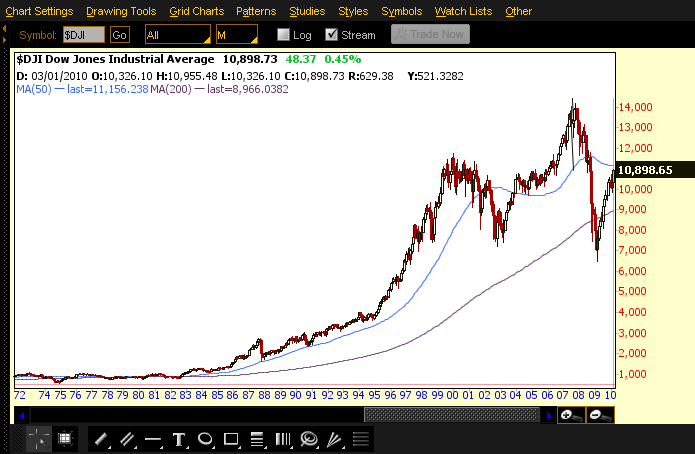
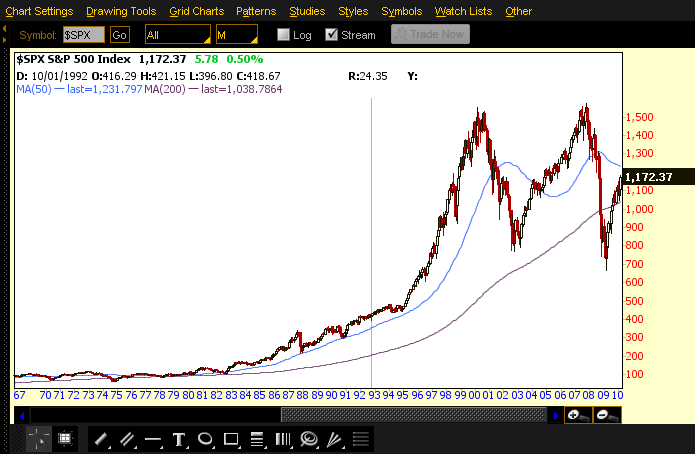
"The bears have been consistently wrong throughout this whole rally," Altucher tells Aaron in the accompanying clip. "If you followed the bears' advice at the bottom you'd be dead broke right now." For full disclosure, Altucher did not call the market crash in 2008."Better to be consistently bullish than consistently bearish." Well now that's math: 70% of the time the market is ascending, historically. The problem is that when it declines it almost always goes down much faster than it goes up, and due to that pesky math again if you lose 50% you must get a clean double to be "back to even." Someone better look at the 1930s. We had the same sort of calls then - and there was a ferocious rally fueled in no small part by people who were convinced that 1929 was just a "garden-variety panic." They were wrong. When the market rolled over for the second time instead of collapsing in a spectacular crash it instead ground lower for years, and in fact we did not see a secular bull market again until the 1950s - following a World War! Worse, while the market did make its "low" in 1932, it still doled out a 50% loss from 1937 to 1942, as you can see here: The question, of course, is "where are we now"? From today's charts you can make a number of arguments but "correlation" is going to be missing in all of them. Indeed, going back through the entire range on this chart I can't find a pattern that looks like this - so those who claim "we have a good fit" are trying to fit a thesis to a chart, rather than finding the chart fit first and thenextrapolating. I can make a fairly clean argument that this is a head and shoulders pattern in development. A fall below ~6,000 in the DOW would confirm this, although such a fall might not come for as many as five years (if the chart is symmetrical.) By the way, should that happen the downside target is, effectively, zero(14,000 - 7,000 neckline, approximately = 7,000 points down for the target!) Is that extreme? Sure is. But the S&P 500 looks an awful lot like a double top, and the target on that, if it is, happens to be a full retrace of the move that led to the double top. Being generous this puts the long-term target at 400, being "aggressive" puts the view more in line with 1988, which is roughly half that. Now you know where my "SPX 210.23" came from that's in the header of The Market Ticker. You could call that sort of view catastrophically bearish, of course.
 click on url for complete article