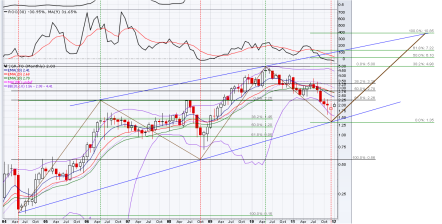
Starting in 2004
Major Move 1 - Up
.15 to 2.25
.15 - 0%, .95 - 38.2, 1.20 5%, 1.45 - 61.8%, 2.25 - 100%
Major Wave 2 - Down
retrace to .57 (.57 is ~50% of .15 and .95) with Wave 1 high of 2.25 becoming 38.2 Fib level for next move from .57 to $5.
Major Wave 3
.57 - 0%, 2.25 - 38.2%, 2.78 - 50%, 3.30 - 61.8%, 5.00 - 100%
Major Wave 4 - Down
retrace to 1.35, ~exact % retracement as Wave 2(1.35 is ~50% of .57 and 2.25) with a similar timeline down as Wave 3 up.
Wave 5
1.35 to 10.85. As in Wave 3, previous Wave 3 high of 5.00 is the new 38.2 Fib level for the move. Time line fits for sometime in early 2014. Probably a Friday ;)
1.35 - 0%, 5.00 - 38.2%, 6.10 - 50%, 7.22 - 61.8%, 10.85 100%.
At this point it could keep going or break above the top channel in a blow off perhaps on a takeover or some other freakish event like a Goldcorp type discovery.
In all reality, a $3.5 billion market cap is not out of the question with gold over $2000, production ~ 200k/y and 5 million ounces in the ground.