From the other board
Here's a look at the technical indicator charts for the Daily and Weekly time frames. Remember, it is just my opinion. I am sure there are others out there.
As I indicated earlier in the week, I think we are about to break out of the trading range we been in for a long long time now. It is a little clearer on the weekly chart, where you can see an ascending triangle has completely formed at the resistance level of .57/.58. Folks, this one is wound up tighter than a ...... Well, you get the message.
This major resistance level will most likely be taken out with any hint of positive news from the company. I suspect Mr Steiner is chaffing at the bit, and biting his tongue to let the news flow. Time will tell soon enough. I wouldn't be surprised if something major comes out next week. This would be a perfect time, especially with the big PDAC show in town, plus with how the stock is looking according to the technical indicators. All the stars are lined up perfectly at this point. Hopefully we don't blow another opportunity to blow the doors off this one. Are you listening Mr Steiner!!!!!!
Actually, I wouldn't be surprised if drilling starts early as well. I know the news release says late March, but my goodness, I bet Mr Steiner can't wait to say, DRILLING HAS STARTED. Anyone know what the weather is like in Idaho where our property is?
Good luck to all, and may we have a prosperous week ahead.
I hope these charts come out ok. This site can be finicky at times.
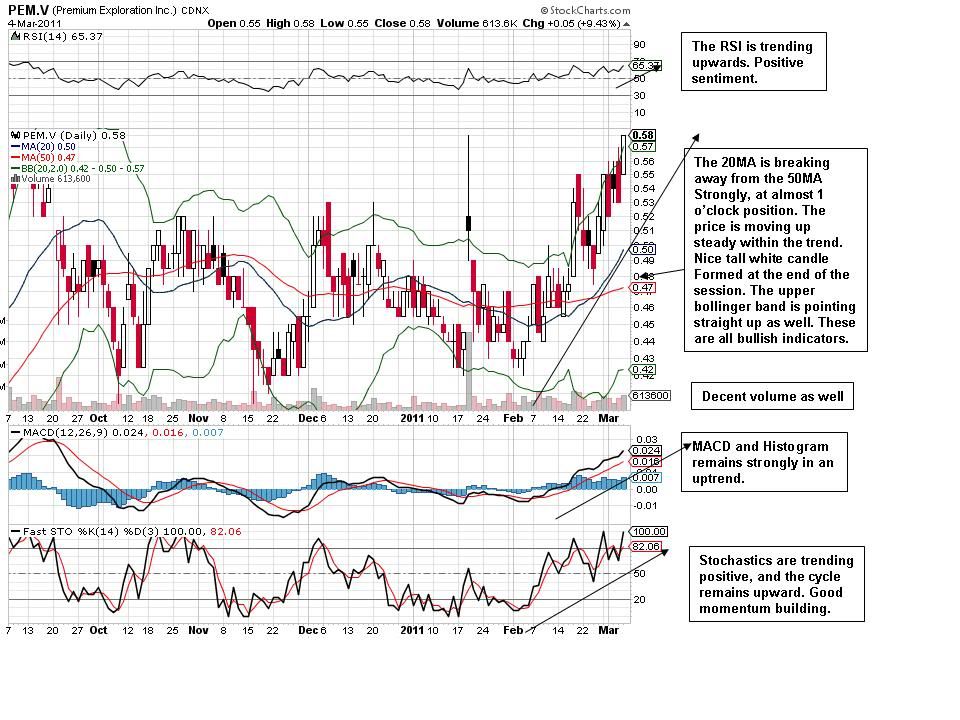
DAILY CHART
WEEKLY CHART


