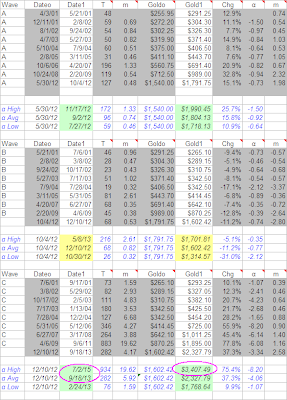
I hinted back in September that
fishing hook were coming. Gold and silver must be accumulated when the fish start nibbling at the hooks (chart 1).
Chart 1: Silver London P.M Fixed and the Silver Diffusion Index (DI)

The first and completely predictable dip in the A-wave rally has a growing number of fool's gold experts and community members convinced another big, D-wave style decline has begun. My bandwagon response to that would be what a bunch of
malarkey.
The invisible hand is very good and creating doubt. Well-timed paper supply at critical D-wave resistance (arrowed red shadow boxes in chart 2 and chart 3) generates more self doubt than the combined efforts of all
high school cliques. If the invisible hand controlled (rather than managed) the price of gold, it would still be trading at $20/ounce. America's partial and total control over gold was reliquished in 1934 and 1971, respectively.
Chart 2: Gold London P.M Fixed and Long/Short Concentration Index (CI): 1 = Bullish Setup, -1 = Bearish Setup

Chart 3: Silver ETF (Silver) and the Silver Long/Short Concentration Index (CI): 1 = Bullish Setup, -1 = Bearish Setup

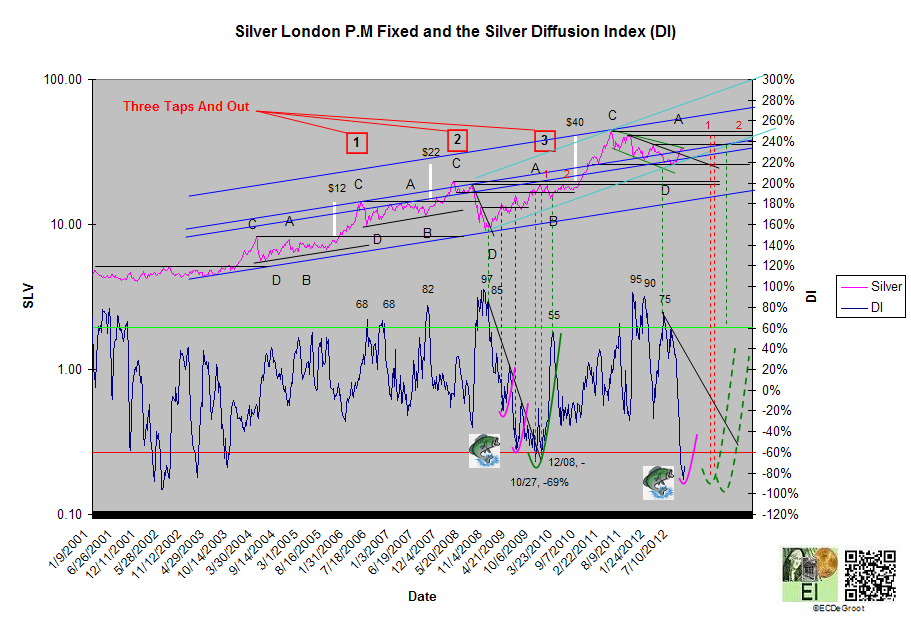
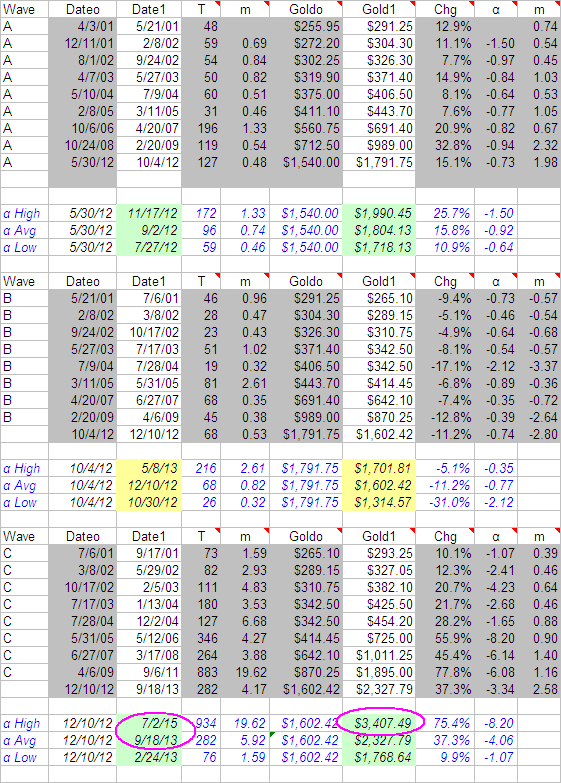
I like Jim's response for those that believe the price of gold can be easily controlled to prevent a run to $3,500.
Follow the others advice, go away and be happy.
Jim's $3,500 expectation will likely be realized between 2013 and 2015. The ABCD gold wave table which will be fined tuned in the coming months shows the relevancy of this expectation.
Table: ABCD Gold Wave