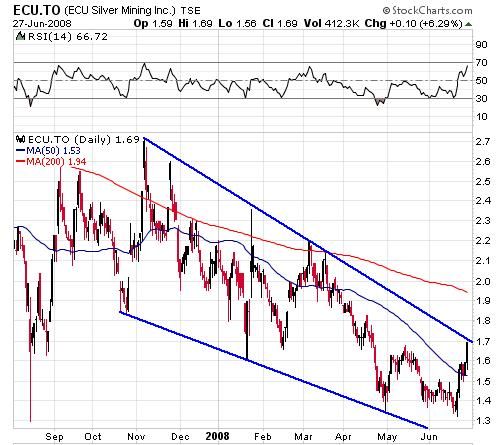
The chart does look promising as it makes yet another attempt at breaking through this 8-month long falling wedge formation. If it can successfully breach this resistance the next critical levels will be $1.94 (200 dma) and $2.10 which coincides with the longer 18-month long down trend line.
We can be assured that the technical traders are well aware of this and will add further buying pressure when this level is taken out. Next week could be interesting folks.