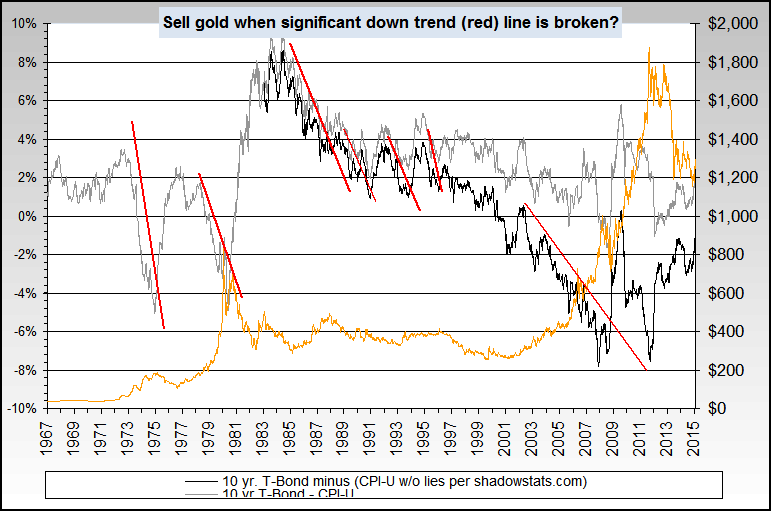
via NowandFutures.com - Negative Real Rates
In the negative real rates chart for Nowandfutures.com, s buy signal and a sell signal come at the same time. That would mean that this model is no longer viable. However, the position of interest rates against inflation shows that gold prices should be where they are.
That means the gold bull market has long been over, and gold's re-rating is complete. Interest rates of the 10 -year US treasury bond vs. inflation is s good indicator of where the gold price should be.
This does not preclude further declines in interest rates, especially where treasury bills are concerned.
Now And Futures
$IRX Weekly
The one chart that can breath life into the gold market is the Three-Month Treasury Bill rate. We had the US treasury absolutely flood the money market with treasury bills this week since any disputes over spending bills would push rates into the negative.
A negative rate would push money into bullion.
http://scharts.co/1BupPwm
$GOLD:$CDW Monthly
Gold prices in Canadian dollars have already broken out in the linear scale monthly chart, and will soon break out on the log scale:
http://scharts.co/1BupPwm
-F6


