
Charts & Comments
posted on
Nov 15, 2013 10:41AM

Saskatchewan's SECRET Gold Mining Development.

via Hussman Funds - Weekly Comment
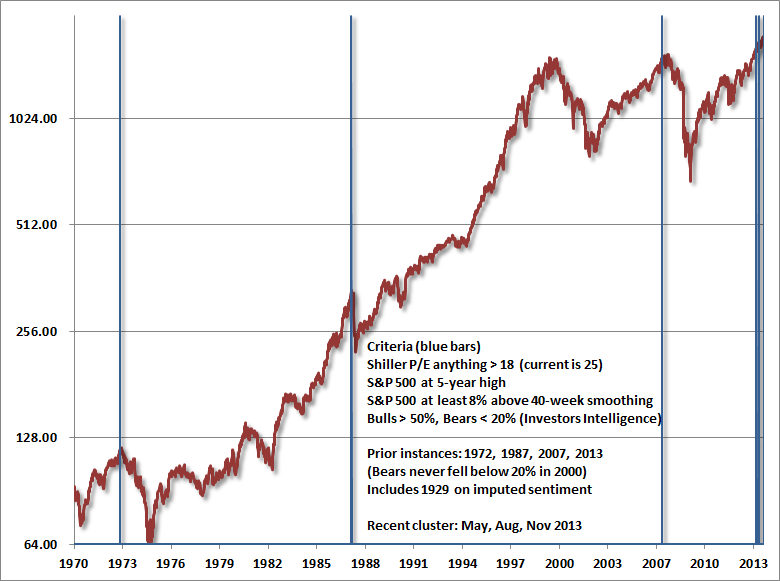
Hussman Funds had a chart in their weekly comment that caught my eye, which was a long term chart of the Dow with vertical blue lines denoting set conditions for a market crash.
I had also searched for a history of market crashes, and found very little in the way of comparison for the present day.
The one crash scenario that no one is looking at is the 73 - 74 market crash. It makes a short read on wikepedia.org to realize that this one particular crash makes a strong comparable to present conditions. This set of circumstances eerily recall for us a past forecast for contemporaneous markets.
This market rout started in January, 1973.
http://en.wikipedia.org/wiki/1973–1974_stock_market_crash
Central bank intervention in the gold market since the gold market bottomed means that something is in store, but we don't exactly know what that might be. The gold price decline would be attributed to an interim bond market correction, and temporarily rising yields.
Perhaps there's some truth to the rumour that the Chinese are prepared to float the Yuan, and were given precedence by western central banks to diversify their foreign exchange reserves into gold in order to effect the change.
source: http://www.hussmanfunds.com/wmc/wmc131104.htm
$INDU Monthly
Jay Taylor maintains that we are going to see a major risk reversal, where the Dow declines, while gold rises. I am not so sure that gold miners will see such a major boon so swiftly, in a massive historic bear market where credit is unavailable. Gold aught to see an advance as equities come off, bond markets are bid, and short term rates achieve negative nominal rates.
Gold miners in production had better be prepared to make strong distributions out of free cash flow, otherwise, they will have set themselves up for a cheap takeout. Stock markets will decline precipitously until dividend paying stocks make compelling buys because of their yields.
TD.TO Monthly
There is no better expression for the state of Canadian markets than the bank stock bubble.
Many a sell-side broker foundered on the rise of Canadian bank stocks. Banks are probably providing vendor financing to prop up their shares. They are also overwhelmingly short the gold miners.
TD.TO has depended on the rise of the Canadian dollar against the U.S. dollar, but it's difficult to pick out an inverse correlation that will suit to indicate a top.
TD.TO:$Gold Monthly
TD.TO:$Gold has strong inverse correlation at market tops denoted by elliot wave counts when you measure TD.TO in U.S. dollar gold terms and correlate that with $CAD.
Part of their success in recent months has been due to massive profitable gains on equity swaps held against resource companies in the oil sector and the gold sector.
This can only be deemed a success if there has been a drastic loss of purchasing power in the Canadian dollar.
XBB.TO Monthly
The full expression of financialization in Canada can probably be found in XBB.TO. The bond market was being discussed here:
http://talkdigitalnetwork.com/2013/10/no-black-septemberoctober-this-year/
Nowandfutures.com - Negative Real Interest Rates
The reason why gold prices are up is that real interest rates using a non-hedonic approach on inflation perhaps comprising inflation, currency depreciation and loss of purchasing power, shows that once interest rates begin their decline again, that gold prices will rise.
Short term interest rates aught to see nominal negative interest rates for treasury bills in a market rout, giving a major boost to gold prices, as in money market terms.
http://www.nowandfutures.com/forecast.html#predict_gold
-F6