
Re: Charts & Comments - Gold Weekly
in response to
by
posted on
Mar 22, 2013 05:40PM

Saskatchewan's SECRET Gold Mining Development.

$GOLD Weekly
An interesting development in the EMAs of the 13-week touching the 89-week occurred as gold prices were coming out of the slump in 2009. The bottom and moving averages touching occurred simultaneously.
This week, we are see again the touching of both the 13-week and the 89-week EMAs, although the price bottom occurred over a year ago.
Analagous price moves can be expected in the weeks following. Precious metals options expiry is Monday, 25 March.
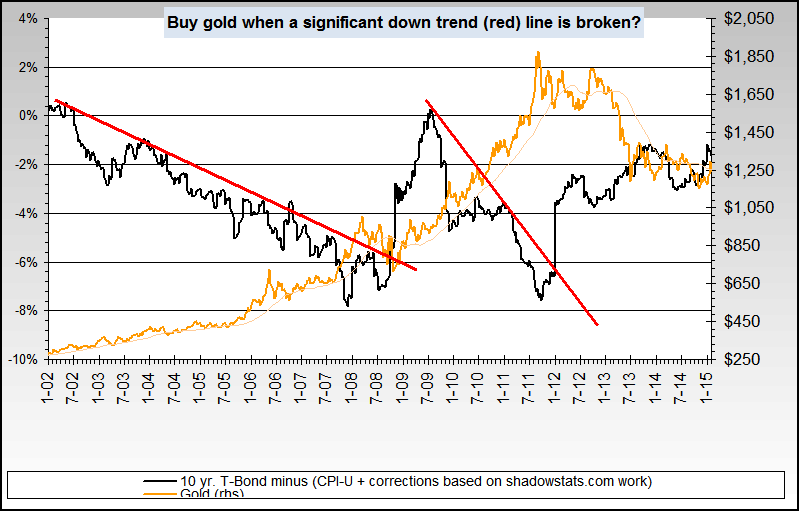
Note that in nowandfutures.com gold price chart, with negative real interest rates as a reason for gold price rises, shows that when gold prices recovered in 2009, interest rates rose. This did not prevent gold prices from recovering after the correction.
The Elliot Wave count on the weekly chart conforms with the Sharelynx Gold eWave chart, though it's looking increasingly as if it might be disqualified. All other price schemes have been disqualified up to this point since they got either the price wrong, or the date wrong.
RealTerm's Dax In Gold is expecting a 3000€ gold price for 2015.
If you accept that the Dow/Gold ratio is meant to achieve a 1:1 ratio eventually, then the emerging broadening pattern on the chart suggests an eventual gold price target of ~$3700 - ~$4100/oz.
-F6