
Charts & Comments
posted on
Jan 01, 2012 10:09AM

Saskatchewan's SECRET Gold Mining Development.

"The L-shape"
The L-shaped recovery in the bear market trend in gold prices gives you an abundantly clear idea where the bear case is going. At one time, people firmly believed that the rise in gold prices was over so much so that they bid the bear ETF in gold up to $500.-
So if you happen to be chewing gum and have a printed copy of this chart in your briefcase, just stick a copy face up on Dennis Gartmann's forehead.

supersize: http://www.flickr.com/photos/11747277@N07/6612312405/sizes/l/in/photostream/
Gold Monthly Log Scale
I was looking for a close slightly above the very long term trend this month, but that was not to be. The chart now becomes a simplified version of its previous uptrend, now clearly marked in light blue.
I would not be assigning an elliot wave count to this latest correction just yet, even though it comes at a two-year cycle high. If I were to look for antecedents in the monthly chart, this latest move is not unlike the spring 2004 correction, where it took six months to recover the high, and was two years before another cycle high. Another possible antecdent was the November - December 2005 correction.
It appears that sideways trade for some months is probably in store, Jim Sinclair has already discussed the idea here:
http://www.jsmineset.com/2011/12/26/a-modest-1700-2100-gold-price-in-2012/
It would be thoroughly ironic if the average price was around the $1800/oz. mark for our purposes, since this is twice the acknowledged cost basis of $900/oz. It may actually accomplish this in Canadian Dollar terms.
The one reason why I might believe that a sideways trade in gold is wrong, would be that the fundamentals are that short term rates are still flirting with negative nominal rates. Should Operation Twist be recognized as falling short of preventing this trend, and that its merely another form of QE, then long term rates will rise as short term rates fall resolutely into the negative.
Euro area yields at the short end of the curve are negative(run cursor over chart):
http://www.ecb.int/stats/money/yc/html/index.en.html
A rate like this makes sense from the point of view that Libor might be astronomical, and that banks looking to park money might obtain tax benefits by purchasing treasuries with a negative rate.
The implication of having gold trade sideways for an extended period, or around a price averge at these levels would probably mean that its trading around a very long term inflation-adjusted price average. The last time that gold prices traded around its 40-year inflation adjusted average based on 2009 constant dollars was in 2006 - 2007.

supersize: http://www.flickr.com/photos/11747277@N07/6612417987/sizes/l/in/photostream/
GBN Monthly
Not much to say about the GBN.V price chart, except that aside from the jitney-traded daily activity, the price probably reflects a 1 P/E of forward net and comprehensive earnings.
The company has not released grades and processing rates or any notion of production which are crucial to determining the price. Either that, or the company is facing total disaster judging by the price. Go ahead, just try to justify to anyone making an investment here.
The weekly chart has a series of parallel lines that if it was applied to the low in 2008, probably gives us the low in 2012. So if we say that we have 22¢ as a low, and that this is quite possibly a 1 P/E of forward net and comprehensive earnings the production rate will have to be more like 82,000 oz/year (rather than 70k) or the gold price will trade around $2000.-
Bond markets will have to come off for a price rise in the stock, but there was a stretch from 2002 - 2006 where both bond prices and GBN.V stock did pretty much nothing.
This is why I am so adamant that dividends must absolutely be paid.

supersize: http://www.flickr.com/photos/11747277@N07/6612619563/sizes/l/in/photostream/
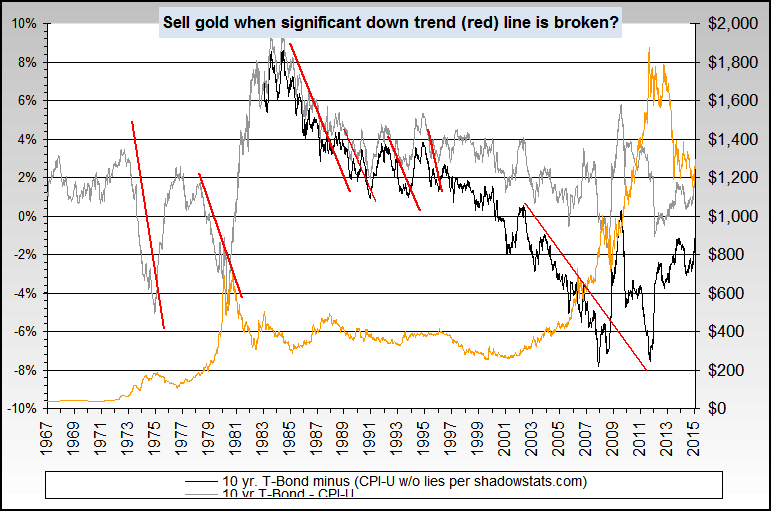
Negative Real Interest Rates
Negative real interest rates differ from negative nomiminal interest rates in that rates below inflation in long term bonds are considered as negative real interest rates, while negative nominal interest rates are treasury bill rates that have actually fallen into the negative due to financial system pressures. A negative nominal interest rate became the policy rate for treasuries in 1938.
As you can see from this chart, even though interest rates were advancing in the 1970's, they were still falling behind inflation, thus negative real interest rates. The situation is technically very similar to now, in that though inflation is considered to be low, interest rates have fallen below it. The inflation rate is, in fact much higher than hedonic numbers given to the public, so the inflation rate used here is higher than government statistics.
By now, regardless of what inflation rate you use, long term government bond yields have actually fallen to the government statistical rate.
source: http://www.nowandfutures.com/forecast.html#predict_gold
-F6