Charts & Comments
posted on
Mar 26, 2011 12:27PM

Saskatchewan's SECRET Gold Mining Development.

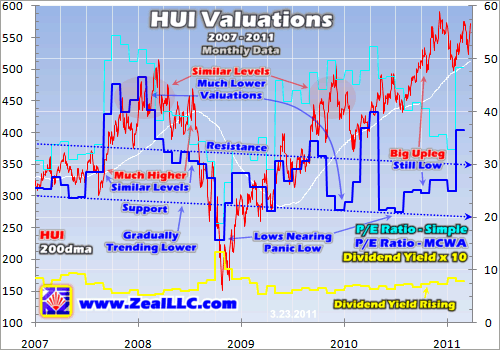
One Chart Says It All
One chart says it all about producing gold miners, this is one detail surely missed by most of the investor crowd. Now, if the numbers coming out of Roy Lloyd are correct, that the head grade of the mill would be in the range of roughly ~17 - 20 g/t, as have other producing mines in the belt, then GBN.V is valued as a gold explorer with only 1 million ounces in the ground.
Now, the last time anybody compiled information on valuations was Edson of London January, 2010. Golden Band, with its huge float, but restricted market cap is trading according to the valuation of its gold in the ground on an inferred basis, and has made no significant advance in terms of valuation since the 1980's.
The Saskatchewan Mining And Development Corporation (now privatized Cameco) drilled off all of these deposits, though GBN.V made a breakthrough on Roy Lloyd by connecting the bingo deposits.
"The Bingo Structure, at present, has an average width of 2.8 m (9.2 ft)
along a strike length of 285 m (935.0 ft). "
source: http://www.ir.gov.sk.ca/dbsearch/MinDepositQuery/default.aspx?ID=2627
Thus, the Bingo structure, or the Roy Lloyd mine, is twice the strike length of the depression-era Pickle Crow Lake mine, which was considered the proverbial gold mine due to its paying a dividend to its shareholders for some 30 years. Bear in mind that the Rod Zone of the former Jolu mine in the vicinity of the mill has a 900m strike length , and that's just one zone. The Jolu complex of deposits and the Bingo deposit are very similar in nature and disposition. (My reading on that is Jolu is a good comparable to the former Lamaque mine in Val D'or, even though there is zero information to go by.)
The company has not provided any easily discernible graphic that shows the strike length of the Roy Lloyd mine, so very likely the strike length of the high grade portion is somewhat larger.(though I don't think this can be improved upon by a very significant amount.) None of the diagrams or any information on the mine are recent, and date back to 2006. The overall strike length of the Bingo deposit is 900m.
The challenge for the investor would be to take on a reasonable portion of the float within their means, and to keep up with dilution when it occurs. This is no easy task.

btw, this article basically says it all:
source:http://www.zealllc.com/2011/huivalu7.htm
Wall St. Journal Article
The Wall St. Journal recently came out with an article with very similar conclusions, but focussed on the majors. A decline in P/E along with a rise in dividend yields.

Seeking Alpha
"Being in the business of literally pulling cash out of the ground means that precious metal miners must pay higher and high dividends to maintain their claim as an option on bullion prices that is more attractive than merely physical gold."
Seeking Alpha - Gold Equity Outlook
Reuters
A more pessimistic outlook for gold miners at Reuters. Should commodities prices decline, and gold manage to keep its value relative to these declines as it had in 2008 - 2009, then the thesis that rising costs may affect gold miners is wrong.
GBN.V has two analyst ratings: Financial Times The Financial Times concludes that interest rates are set to rise, and that this will affect gold prices in 2012. But the comparable with the 10-year TIPS yield suggests that either the gold price must rise to meet with the declining inverted rate curve, or that rates will rise on TIPS. Rates on TIPS should theoretically rise in a deflation. This would be independent of long term bond rates. Aussie Gold Stocks If any gold mining stocks suffer from the same race to dilute the shares as Canadian stocks, it has to be Aussie gold stocks. The charts look the same and make good comparables: http://www.safehaven.com/article/20342/aussie-gold-stocks-surge The Saskatchewan Budget http://cnews.canoe.ca/CNEWS/Politics/2011/03/23/17731876.html Monthly GBN.V Chart Stockcharts.com has now provided price data going back to 1996, though price data actually goes back to the early 1980's. For the moment this provides a window on how the stock price is faring under a brutal naked shorting regime. One thing that comes to mind is the very long term development phase of the stock since yr. 2000. This is not unlike the monthly Silver chart. This has me thinking that there's no use attempting to forecast the wave count, since the next phase is likely to be very choppy. What the data set does give us is the former price resistances, which the stock price is likely to challenge. A ~$3 stock price in 1987 would mean a ~$5 stock price in 2011 on an inflation adjusted basis: supersize: http://www.flickr.com/photos/11747277@N07/5560978899/sizes/l/in/photostream/ -F6