|
House Positions for C:FO from 20150707 to 20150707
|
|
House
|
Bought
|
$Val
|
Ave
|
Sold
|
$Val
|
Ave
|
Net
|
$Net
|
|
143 Pershing
|
27,000
|
4,590
|
0.17
|
0
|
|
|
27,000
|
-4,590
|
|
79 CIBC
|
27,000
|
4,547
|
0.168
|
13,000
|
2,125
|
0.163
|
14,000
|
-2,422
|
|
2 RBC
|
11,000
|
1,920
|
0.175
|
0
|
|
|
11,000
|
-1,920
|
|
9 BMO Nesbitt
|
10,000
|
1,600
|
0.16
|
0
|
|
|
10,000
|
-1,600
|
|
85 Scotia
|
8,000
|
1,318
|
0.165
|
500
|
85
|
0.17
|
7,500
|
-1,233
|
|
99 Jitney
|
12,000
|
2,015
|
0.168
|
10,000
|
1,700
|
0.17
|
2,000
|
-315
|
|
22 Fidelity
|
1,500
|
240
|
0.16
|
0
|
|
|
1,500
|
-240
|
|
124 Questrade
|
0
|
|
|
8,000
|
1,320
|
0.165
|
-8,000
|
1,320
|
|
39 Merrill Lynch
|
0
|
|
|
11,500
|
1,906
|
0.166
|
-11,500
|
1,906
|
|
7 TD Sec
|
0
|
|
|
25,500
|
4,304
|
0.169
|
-25,500
|
4,304
|
|
1 Anonymous
|
11,000
|
1,840
|
0.167
|
39,000
|
6,630
|
0.17
|
-28,000
|
4,790
|
|
TOTAL
|
107,500
|
18,070
|
0.168
|
107,500
|
18,070
|
0.168
|
0
|
0
|
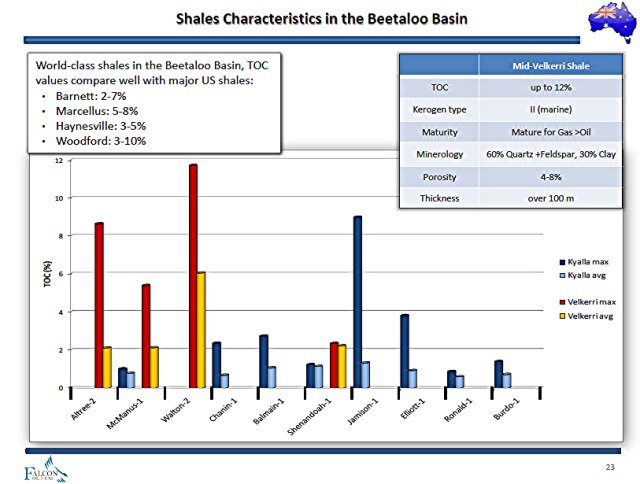
Shale Oil and Gas. America has done it.
Now it's Australia's turn.
Compares with Barnett, Marcellus, Haynesville and Woodford shales