
Will GOLD Take Off?? or SILVER ??
posted on
Jun 05, 2019 03:33PM
We may not make much money, but we sure have a lot of fun!

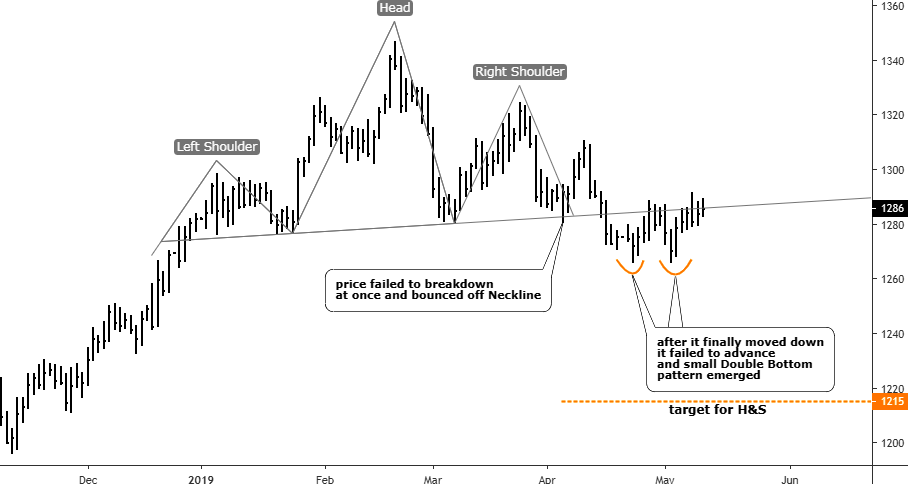
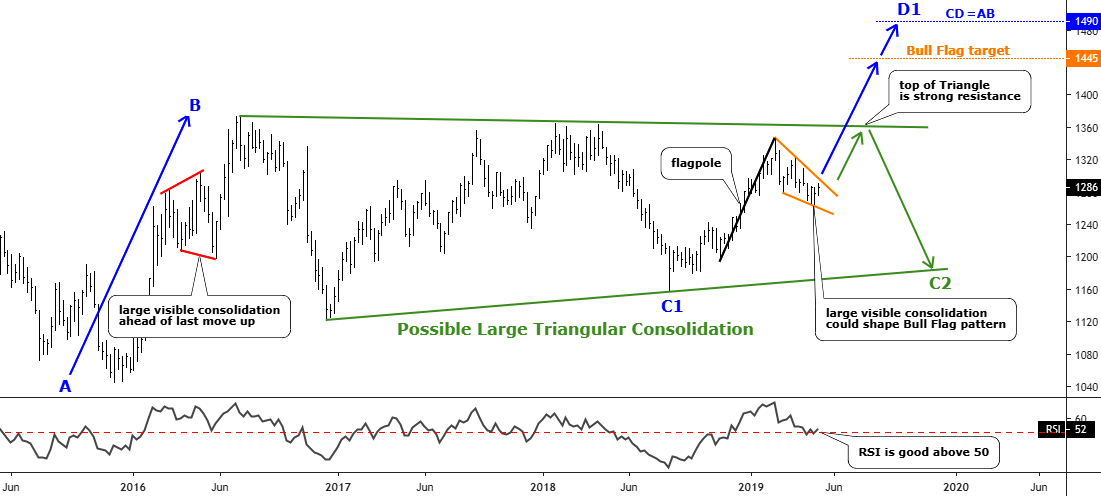
In the middle of May, I questioned if the Head & Shoulders pattern, that was detected in April was still intact. Most of you agreed that there was enough evidence to drop that bearish idea, moreover, the new Bull Flag pattern was spotted on the weekly master chart.
Besides that, one of the readers kindly enriched our view, noticing another bullish Cup & Handel pattern that supported the upside expectation.
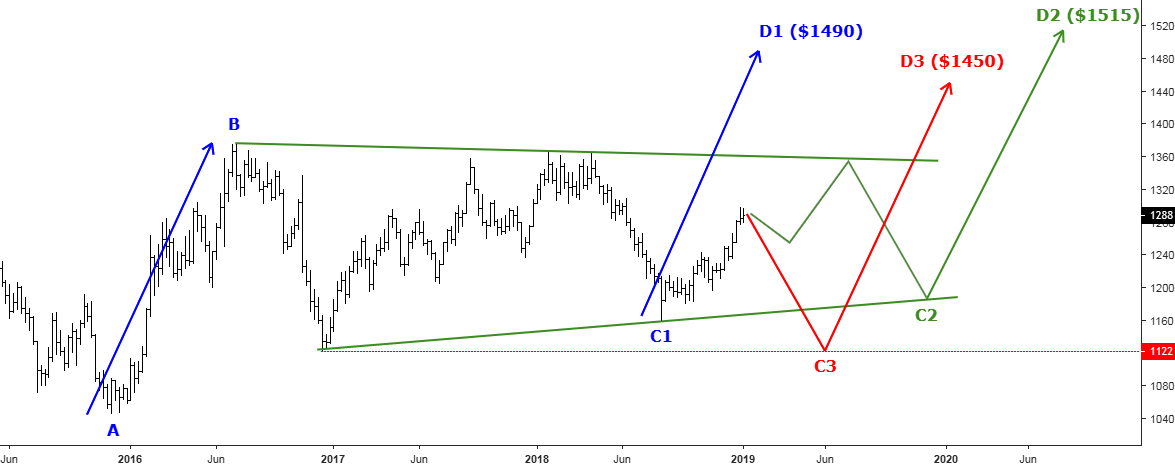
Last Friday, the gold took off its upside journey as the Bull Flag was breached to the North as price finally moved beyond the $1300 handle and overcame the minor top established on the 14th of May. The targets were set before, let’s hope for the best!
But what about silver? Last time I wrote about it in January using experimental clones from history. This metal had an ugly chart structure as gold had a clearer one. But no matter how the market tries to confuse us sooner or later we will see the end anyway. Again silver has been a laggard behind gold, and the latter gives us a clue as it broke up the resistance.
Let’s see, in the chart below if we can find gold’s shining in the silver market.

Chart courtesy of tradingview.com
I labeled the first upside move, which kicked off last November as the AB segment. It was a good and clean move that brought the silver price from $13.9 up to $16.2 area, making more than 16% profit for bulls. Then the correction had started. I contoured it with two converging orange trendlines. It has a complicated structure. I can imagine how many false signals it could give to the traders as every new low could be the last one before silver might take off to the upside, but then another new low was established. Crazy stuff as I always repeat that corrections are tricky.
This downside move (BC) was deep as it almost fully retraced the preceding upmove (AB). It surpassed the 78.6% Fibonacci retracement level. Last Friday the silver price finally climbed above the former top of $14.65 for the first time and established the new top of $14.68, this is a promising signal as it also pierced the upside resistance. But at the end of the day, the price couldn’t close above it and dropped back inside. The RSI indicator also didn’t confirm the breakout yet as it stays below 50, although it already has a Bullish Divergence on its sub-chart, which consists of higher lows.
One should wait for a clear breakout both on the chart and RSI to confirm the upside move. Some conservative traders would wait for the price to overcome even earlier top of $14.86. The target for the anticipated CD move up is located at the distance of the AB segment added to the most recent low of $14.3, and it is located at the $16.6.
As you might notice, I added the time ranges to the downside of the chart. There are two reasons for that. Firstly, I aimed to show you the confirmations of my words that corrections are time-consuming and they can last even longer than the preceding move they retrace. It’s amazing, but the BC correction has spent exactly the same quantity of bars as a preceding AB segment, 69 vs. 69! This is a wonderful coincidence!
And secondly, I wanted to calculate the time target as I added another 69 bars to the right from the most recent trough. It looks like we should wait until the beginning of September for silver to hit the $16.6.
Aibek Burabayev
INO.com Contributor, Metals