
Good to know. Why GOLD will remain Strong.
posted on
Dec 09, 2012 08:14PM
We may not make much money, but we sure have a lot of fun!

Dear Readers,
Even after numerous letters on why I know gold will remain strong, I still receive questions on the subject.
I've discussed the role of government and central banks, investment demand, and the historical factors that indicate why gold continues to overpower all forms of fiat currencies. This week, I am going to keep it simple: Gold's value is increasing because all other currencies are losing value.
It's about simple supply and demand economics. For those that have been out of school for a while, let me explain.
In microeconomics, supply and demand is an economic model of price determination in a market. It concludes that in a competitive market, the unit price for a particular good will vary until it settles at a point where the quantity demanded by consumers (at current price) will equal the quantity supplied by producers (at current price), resulting in an economic equilibrium for price and quantity.
In other words, price is determined where supply meets demand.
P vertical line = Price
Q horizontal line = Quantity.
Demand is represented by the green curve
Supply is represented by the purple curve.
The equilibrium for price and quantity is represented by the big red dot, where supply meets demand.
Now let's use this in relation to the money supply and demand to determine the interest rate.
Money and Supply Demand Impact
P now becomes the interest rate on the vertical axis, and Q becomes the quantity of money that is borrowed or lent in a given time period. Supply and demand stay the same.

Demand (Green Curve)
When money first becomes available, people are willing to pay a high interest rate because the money supply is low. This is represented by the blue dot on the green demand curve or marginal benefit curve.
Then, every incremental dollar after that, people get less marginal benefit because they may not find a suitable place to put that money. They're borrowing that money for a reason: to buy something, such as a car or a house; to invest and hopefully get a return that's higher that what their borrowing costs; and to consume.
For example, assume there is a consumer wishing to purchase an additional cell phone. If this consumer is willing to pay $100 for that additional phone, then the marginal benefit of that phone is $100. The more phones the consumer has, the less he or she will want to pay for the next one. This is because the benefit decreases as the quantity consumed increases.
This is why you get a marginal benefit curve that's downward sloping, represented by the downward sloping green Demand curve.
Supply (Purple Curve)
The supply curve for money uses the same logic used for the supply curves for any goods or services.
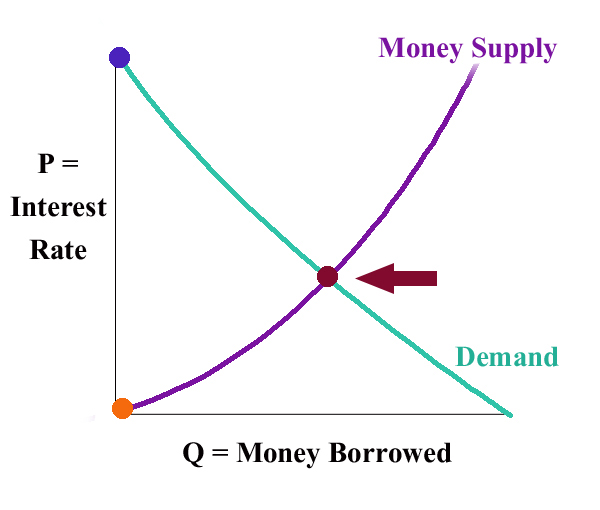
There's a low opportunity cost of lending out the first few dollars, so it is lent out at a very low interest rate; this is represented by the orange dot. Every incremental dollar after that, there's a higher opportunity cost; thus, people will lend it out at an increasingly higher rate.
The opportunity cost is the benefits you could have received by taking an alternative action. The more money you have, the more choices you have; thus, the supply curve is upward sloping.
For example, the more money you have, the more choices you have in how to spend it. Say you invest in a stock and it returns a paltry 1% over the year. In placing your money in the stock, you gave up the opportunity of another investment - say, a risk-free government bond yielding 5%. In this situation, your opportunity costs are 4% (5% - 1%). The more money you have, the higher this cost becomes.
Equilibrium
The point where the two curves meet determines the interest rate.
Now let's look at this theory as it affects us.
When the Fed Prints
When the Federal Reserve prints money, it is for the most part, lending it to the U.S. government via the purchase of government securities. That is how new money enters our system.
What happens to the price of money, or interest rate, when money is printed?

The printed money is represented by the Q horizontal axis, as it is essentially the money borrowed by the government.
When the Fed prints money, they are increasing the money supply. To represent this, we shift our purple supplyline to the right because there's more money in circulation; thus, more quantity (Q) of borrowed money in a given time period. See above chart.
Now let's assume money supply is the only thing shifting. You can see that the new equilibrium price of money, or interest rate, is now lower. That is why current interest rates are at historical lows.
In other words, as the fed keeps printing, interest rates will remain low or the equilibrium wouldn't be equal anymore.
When the fed wants to lower interest rates, they print more money, and vice versa. Conversly, when they want higher interest rates, they contract the money supply; represented by shifting the purple money supply curve to the left.
While there are a lot of macroeconomic variables you can plug into this equation, this is as basic as you can get.
As the money supply continues to grow, the purple curve continues to shift to the right; thus, interest rates will remain low until the money supply is finally contracted.
Negative Real Interest Rates
The interest rates has been forced so low that we're experiencing real negative interest rates.
In other words, the inflation rate is climbing faster than interest rates; that means you can borrow money now and pay it back with cheaper dollars.
For example, if you are earning 2% interest per year on the savings in your bank account, and inflation is currently 3% per year, then the real interest rate you are receiving is negative 1% (2% - 1% = -1%). That means the real value of your savings, when purchasing power is taken into consideration, will actually decrease by 1%. You lose 1% for every dollar in your bank account that you think is returning you 2%.
Your purchasing power decreases, as the money supply increases.
The Reality
You've heard of Quantitative Easing, or QE. You know how much money has been printed. I've mentioned this in many past letters, such as America's Gold Wiped Out. I am surprised the market doesn't give this more attention.
The latest round of QE should have shocked the world. As I mentioned in the Letter, "The Assassination," the latest round of QE3, or QE to infinity as I call it, is far greater than a trillion dollars.
Think about it: $85 billion dollars per month of QE stretched over a one-year time period ($45 billion/month operation twist + $40 billion/month QE); that's equal to more than $1 trillion dollars. And the Fed will keep this up until it fixes the economy, and "for a considerable time after that..."
Gold Supply and Demand
Now let's apply the exact same model to determine the price of gold.
Data clearly shows that the demand for gold is rising; there's no arguing that. But gold supply, unlike dollars, is limited and cannot be forced incrementally higher with the push of a button, as is the case with the supply of money.
I have already explained how gold demand is increasing, led by central bank buying and investment demand (New Rules for Banks that Will Change the World.)
Let's take that and put it into the supply and demand chart perspective.
If demand for gold stays the same but gold supply contracts (a shift to the left on the purple supply line), look what happens:

The price of gold becomes higher. Simple.
Now if supply is constrained and demand increases, look what happens then:
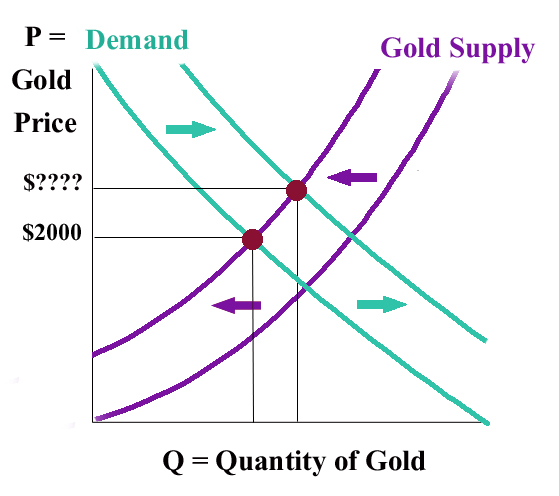
The price of gold rises dramatically. The question is: by how much?
The supply of gold is extremely limited. That means the only big shifts can come from demand...
There is no switch that someone can magically press to increase the supply of gold. It's relatively inelastic; even if gold prices were to soar, gold production can only increase by so much. Technically, gold supplies don't decrease, but supply constraints can occur as central banks hoard gold and remove it from the consumer market.
Supply Constraints
The only way to get increase the supply of gold is through mining.
As more mines are shuttered (due to rising costs and politics), the supply constraints become greater. That will simply force the price of gold to move higher as supply cannot keep up with demand. It's that simple.
Gold Deposits: Extremely Rare Real Estate
A recent study by National Resources Holdings confirmed both the scarcity of gold deposits as well as the lower-grade production trends facing the industry.
They put together a comprehensive study of 1,896 publicly traded companies that are in some way involved in gold production, exploration, or development of over 7000 geologic anomalies with a goal to find undeveloped gold deposits or producing mines that hosted more than 1 million ounces of in-situ resources under a globally respected mineral definition standard such as CIM NI 43-101, JORC or SAMREC.
They were able to identify only 439 mines or deposits containing over 1 million ounces of gold.
When you compare this to the number of real estate properties available worldwide, or the nearly 72,000 financial securities available, you can see how rare gold deposits are.
Factor in declining gold grades and the immediate and reflective supply constraints are even greater.
National Resources Holdings further concluded:
"...Out of 439 mines or deposits, 189 are in fact producing mines owned by companies with an average market capitalization of $1.8 Billion. This leaves us with a universe of undeveloped deposits over 1 million ounces of just 250. Of course some of these 250 deposits are owned by miners (84) while just 166 are owned by independent junior companies, private companies, or government sponsored enterprises. Investors seeking leverage to gold should focus on these companies as they provide the best exposure to a rising gold price environment.
...Another caveat with the undeveloped deposits in the database is that some of the largest ones face significant permitting headwinds. Pebble, Reko Diq, Donlin, KSM, and Rosia Montana which represent nearly 20% of the undeveloped ounces in the database may not become mines for 10, 20 and even 30 years.
...While this report and the accompanying database provide an accurate view of global mine supply, there are crucial qualitative metrics still missing. Even high grade deposits with no infrastructure are inferior to easily mined bulk tonnage deposits with close proximity to infrastructure in stable geopolitical jurisdictions.
Looking at the matrix of undeveloped deposits, one can see why size and even grade are not the most important attributes when predicting which deposit will become a mine.
The study then uses an exercise which I find to be of the utmost importance: What will it look like if all 250 undeveloped deposits were somehow permitted and financed tomorrow?
Combining average recovery rates, an average cut-off grade of .66g/t, and a generous figure of 10% reduction for potential pit outlines, they concluded:
"...It would take no less than 25 years to extract the 1,050,000,000 ounces contained within these deposits. Arriving at this figure, we assume that the average build time would be 3 years and the average mill size would be 25,000 tonnes per day.
Even with our unrealistic scenario introducing all 250 undeveloped deposits into the supply mix at once, we can only quantify an increase of roughly 42mm ounces of gold production or 1,306 tonnes per annum. Compare that to current gold production of roughly 2,800 tonnes or 90mm ounces per annum.
Realistically, 50% or more of the deposits in the database will most likely remain deposits 25 years from now for a variety of factors including: permitting, ability to finance a mine, and attractiveness to a producer (producer balance sheets are so large they require significant projects to be accretive , making even most 1mm-2mm ounce deposits unattractive).
The study completed by Natural Resource Holdings clearly shows just how rare economic gold deposits are.
It's clear that the supply of gold and gold deposits is dwindling, while demand is rising. Factor in these shifts into our supply and demand chart and you can clearly predict where the price of gold will be heading into future years.
As I have indicated and stressed in past letters, the importance of a strong gold project with strong economic numbers is paramount to a company's success.
Not only are gold deposits rare, but ones that are economically viable are like a diamond in the rough. That's why it's rare to hear of companies going into production.
Putting a gold project into production often takes hundreds of millions of dollars and years of patience, but finding the right one can often be a very rewarding investment risk.
So share what you find with everyone! To learn more, feel free to call us at 1-888-EQUEDIA ... WEEKLY LETTER