
WHY GOLD HAS SUCH A LONG WAY TO RUN.
posted on
Jan 05, 2011 09:21PM
We may not make much money, but we sure have a lot of fun!

We begin today's reckoning with a trivia question: how many möngös are there in a tugrik?
If you guessed 100, congratulations! If you didn't know, don't worry. The Mongolians probably don't care either way. The tugrik, their national currency, may not be much discussed outside the world's strangest-sounding capital city, Ulaanbaatar, but it was still the world's best performing currency of 2010. Well, the best paper currency, anyway.
The tugrik rallied 15% against the greenback between New Year's Days, narrowly pipping the Aussie dollar, which advanced a none-too-shabby 13% on the world's "preferred" currency, for top spot. The Japanese yen came in at number three.
So what do 2010's two leading coinages have in common that lends them such purchasing power gusto? Well, for one, they are both not the US dollar. Neither are they the euro, widely considered to have turned in the worst performance of the major currencies for the last year, having lost considerable ground against all its fiat contemporaries - the USD, JPY, GBP, CHF, AUD, and CAD.
So that's what they are not. What these two currencies are, however, is perhaps more interesting. Both mediums of exchange are, ipso facto, resource-backed currencies. That is, they derive a good deal of their oomph from the underlying value of the vast endowments of natural resources so abundant in both countries.
It is not surprising that other resource "backed" currencies also faired strongly against Bernanke's faith "backed" helicopter money. The Canadian loonie, for example, closed out 2010 at a 30-month high against the greenback. Even more impressive was Brazil's real, which, after having surged a whopping 37% in 2009, added another 4.4% last year.
Of course, that's not to say that these particular fiat monies are impervious to central banker enthusiasm. Indeed, the pages of monetary history are littered with the charred remains of would-be gold replacements. Even during the Roman Empire, when gold and silver were used for money, coin-clipping meddlers couldn't keep their shears in their tunics.
Not content with burning down his own capital city, Nero lit the tinder under his empire's currency back in 58 A.D., setting the tone for a litany of pyromaniac emperors to follow. By the time Claudius II Gothicus had ascended to the throne (268-270 A.D.) the amount of silver in a (supposedly 100%) silver denarius had wasted to just .02%.
Central bankers, determined to avoid learning the lessons of history, went out of their way to repeat the mistakes of the past throughout much of the 20th century. No doubt the introduction of more combustible paper money aided their cause. From Angola's novo kwanza (AON) to Zimbabwe's doomed dollar (ZWD), more than two-dozen fiat currencies perished amid the fiery lashes of hyperinflation during that period.
In 1923, Germany's Wiemar Republic suffered under inflation that saw prices double every two days. But central bankers were just beginning to sharpen their skills. By 1946, prices of goods denominated in Hungarian Pengos doubled in that country every 15 hours. Then, by 2008, the inflation rate had soared to such troubling levels in Zimbabwe that economists were having trouble just figuring out how to measure it. Finally, after wearing out a few calculators, no doubt, Prof. Steve H. Hanke managed to come up with a figure. Prof. Hanke's HHIZ measure indicated that inflation had peaked at an annual rate of 89.7 sextillion percent (89,700,000,000,000,000,000,000%) in mid-November 2008. Gideon Gono, the Governor of the Reserve Bank of Zimbabwe, had achieved a feat that Nero himself could not have imagined possible.
During this time, gold sat more or less on the sidelines. Nobody's liability, Mr. Midas watched as currencies rose and fell, ebbed and flowed. Some grew stronger, more tended weaker. Indeed, the one thing all fiat currencies have in common, both the weak and the strong, is that they are not gold. They are a liability, an act of faith, a commitment to that peculiar, enduring characteristic of the human spirit that refuses to listen to history or to learn her lessons.
The tugrik and the Aussie are strong for now. But they win by default. Gold, on the other hand, rallied almost 30% in dollar terms last year, handily beating out both of these paper money "winners." In other words, even the strongest paper fell against the precious metal. It might be fairer to say, then, that the Aussie and tugrik were simply the smallest losers.
The supply of paper currencies is infinite; the supply of gold is finite. This striking contrast provides an excellent reason to exchange the former for the latter.
The gold supply is limited...very limited. According to one estimate, all the above-ground gold in the world totals between 120,000 and 140,000 metric tons. Let's split the difference and call it 130,000 metric tons (about 4.2 billion troy ounces). If you brought it all together and made it into a gigantic cube, it would measure about 19 meters along each side - about three meters short of the length of a tennis court.
Furthermore, about 20% to 25% of all the gold is stored in the world's central banks as country reserves. So the total amount of gold in private hands is enough for just 14 grams for each living person - that's less than half the quantity of a standard one-ounce coin like a US Gold Eagle or a South African Krugerrand.
At present, only about 2.25% of the world's total wealth - or 4.5% of world's financial wealth - is allocated to gold, including jewelry. But resurgent inflation could raise that percentage dramatically, while raising the gold price dramatically in the process.
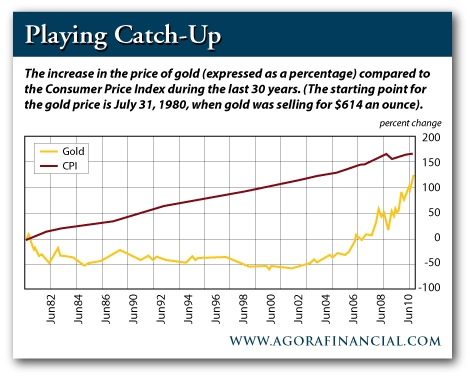
To gain perspective, let's examine a brief history of the gold price relative to US inflation. The gold price peaked in January 1980 at $850/oz. But this peak was very brief. Gold jumped 29% alone in the run towards $660. Probably a better reference point for the market top is the average price during 1980 as a whole. This was $615/oz. Since then, the gold price has increased only 125%.
Over the same timespan, however, the government's most widely quoted inflation gauge, the Consumer Price Index (CPI), has increased 185%. Therefore, if the gold price had increased as much as the CPI, it would be selling for $1,753/oz today, not $1,390/oz. But the official inflation figures might not be the real story. Using alternative inflation figures calculated by ShadowStats.com, consumer prices have soared an astounding 789% since 1980, which means that the inflation- adjusted gold price would be $5,467/oz.
 |
Interestingly, if we look at the market bottoms for gold - 1970 and 2001 - instead of the market tops, the ShadowStats data seem to provide a much more accurate inflation gauge than the CPI. For example, in January 1970 - before gold's 10-year bull run - the price of gold was just $35/oz. Thirty-one years later - after soaring to more than $800 an ounce in 1980 - the big bear market in gold bottomed out at $256/oz. And the average price for 2001 was $271/oz.
Therefore, during this 31-year period - through gold's full bull and bear market cycle - the gold price advanced 674%. Over the same timeframe, the ShadowStats inflation measure advanced a nearly identical 688%. By contrast, the CPI increased only 370% during this period. In other words, the cumulative CPI readings from 1970 to 2001 failed to account for all the inflation indicated by the rising gold price. The ShadowStats figures, on the other hand, were pretty much bang on target.
I'm staying conservative, and there's nothing to suggest that just because using the ShadowStats inflation worked for the bear market lows it will work for the bull market highs. But if the ShadowStats figures above are a guide, then maybe they point to a price north of $5,000/oz for gold - or even $7,000 for a short time.
I've just thrown a lot of numbers at you. But the point is this: gold looks like it has plenty of upside. But let's be really clear about one thing. I'm not making a hard prediction or setting a price target here. These figures just provide reference points. We also need to watch out for gold "going mainstream" - when references make their way into TV programs, when taxi drivers start talking to you about gold and when your mother calls to ask how to buy an ounce of the stuff.
I can easily see gold getting into the $2,000/oz to $3,000/oz range in the next few years - maybe higher. And there's a very real possibility that we'll have a short-term spike - a genuine investment bubble - that takes us into the $5,000/oz to $8,000/oz.
None of this is certain. And it most likely won't happen smoothly. There could even be big corrections along the way - like between December 1974 and August 1976 when gold fell 47% before powering ahead again. But I hope I've shown you that there are good reasons to think that gold still has plenty of room on the upside.
Conclusion: If you own plenty of gold already, then hang on for the ride. If not, buy more on the dips.
Regards,
Rob Marstrand,
for The Daily Reckoning